Friday Chart Fix: QQQ Overtakes QQEW, GOOGL Near New High, Groups with Most Highs, Verizon Gaps Higher

Welcome to your Friday Chart Fix. Today's report starts with year-to-date performance for QQQ and its equal-weight brother (QQEW). We then look at the leaders within QQQ, singling out Alphabet as it is close to a new high. Our attention then turns to small- and mid-caps, since they led the market this week. New highs are still sparse within the space. We then show a ranking table to find the groups with the most new highs. Finally, Verizon Communications (VZ) is the feature stock because it sports a classic setup.
Key Takeaways
- The Nasdaq 100 ETF surges in August to overtake the Nasdaq 100 Equal-Weight ETF year-to-date.
- Alphabet may not be leading, but the stock is in an uptrend and close to a new high.
- When do we take small- and mid-caps seriously? When leadership expands.
- Verizon sports a classic setup: strong group, uptrend and correction within uptrend.
QQQ Outperforms the Equal-Weight Version
The Nasdaq 100 ETF (QQQ) lagged the Nasdaq 100 Equal-Weight ETF (QQEW) from early January to late July. This changed in August as QQQ sprinted to new highs and QQEW did not exceed its late July high. The chart below shows year-to-date performance for QQQ (blue line) and QQEW (pink line).
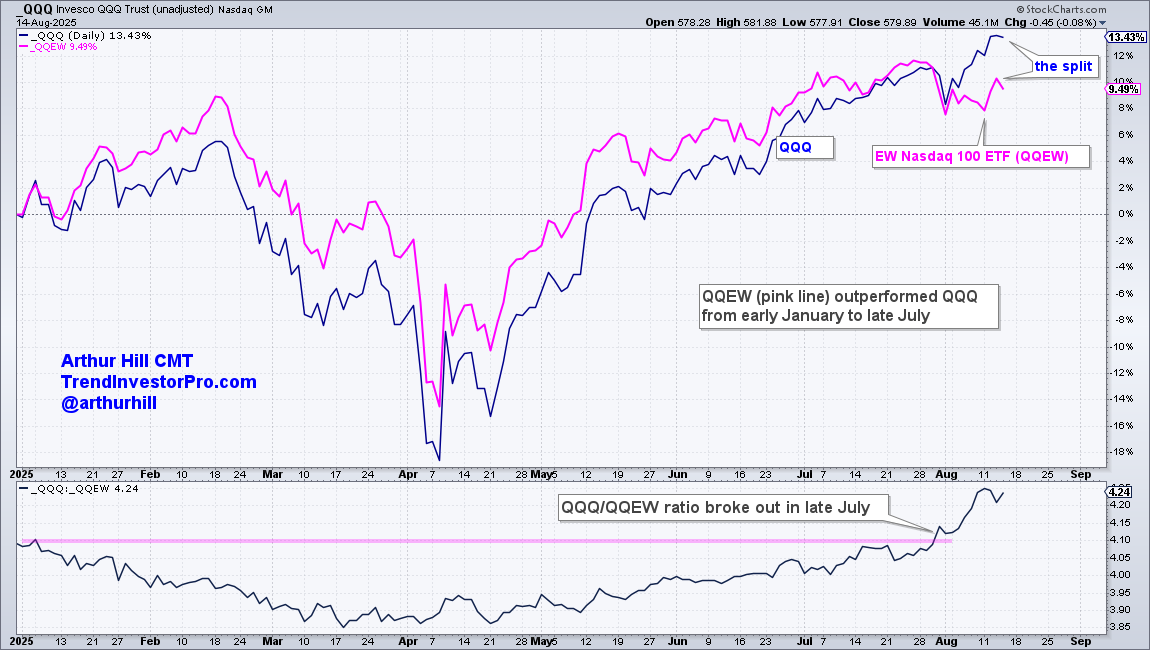
QQQ is up 13.43% year-to-date, while QQEW is up 9.49%. Hard to believe that QQQ underperformed QQEW from January to July. The indicator window confirms renewed relative strength as the price-relative (QQQ:QQEW) ratio broke its January high.
Nvidia, Microsoft, Broadcom, Meta, and Netflix power QQQ
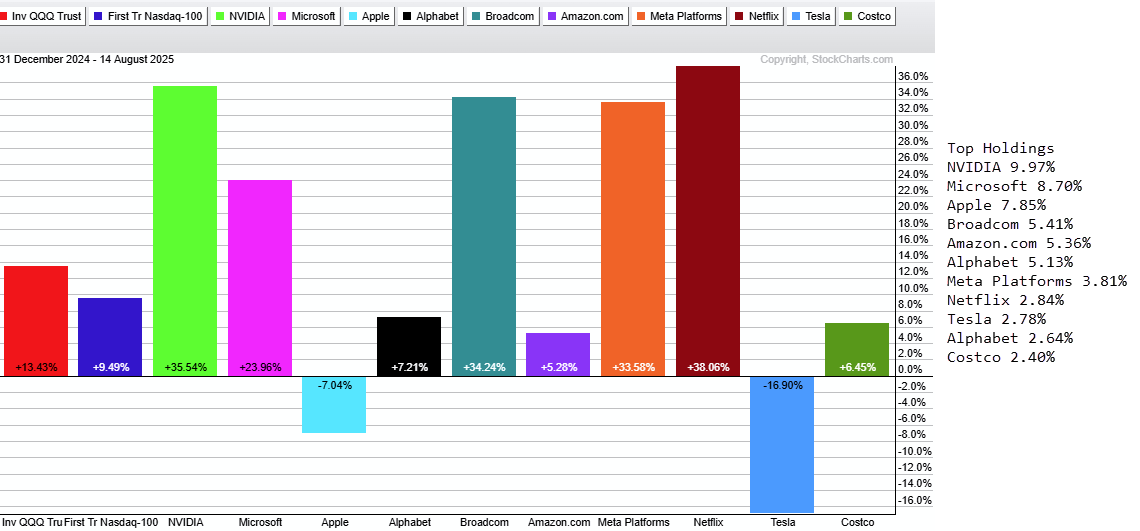
The PerfChart below shows year-to-date performance for QQQ, QQEW, and the top 10 holdings in QQQ. These holdings account for 55.25% of the ETF. Five stocks stand out this year with 20 percent gains: NVDA, MSFT, BRCM, META, and NFLX. Apple (AAPL) and Tesla (TSLA) are down year-to-date, but both are showing signs of strength (as noted on TrendInvestorPro). Note that Alphabet accounts for just 5.13% of QQQ, which is less than Apple, Amazon, and Broadcom.
Alphabet Closes in on Prior High
The chart below shows weekly bars for Alphabet (GOOGL) with the PPO(4,52,0), which shows the percentage difference between the 4- and 52-week EMAs. 4 weeks covers a month, and 52 weeks covers a year. A long-term uptrend signals when the PPO turns positive (blue dashed lines) and a downtrend when it turns negative (pink dashed line).
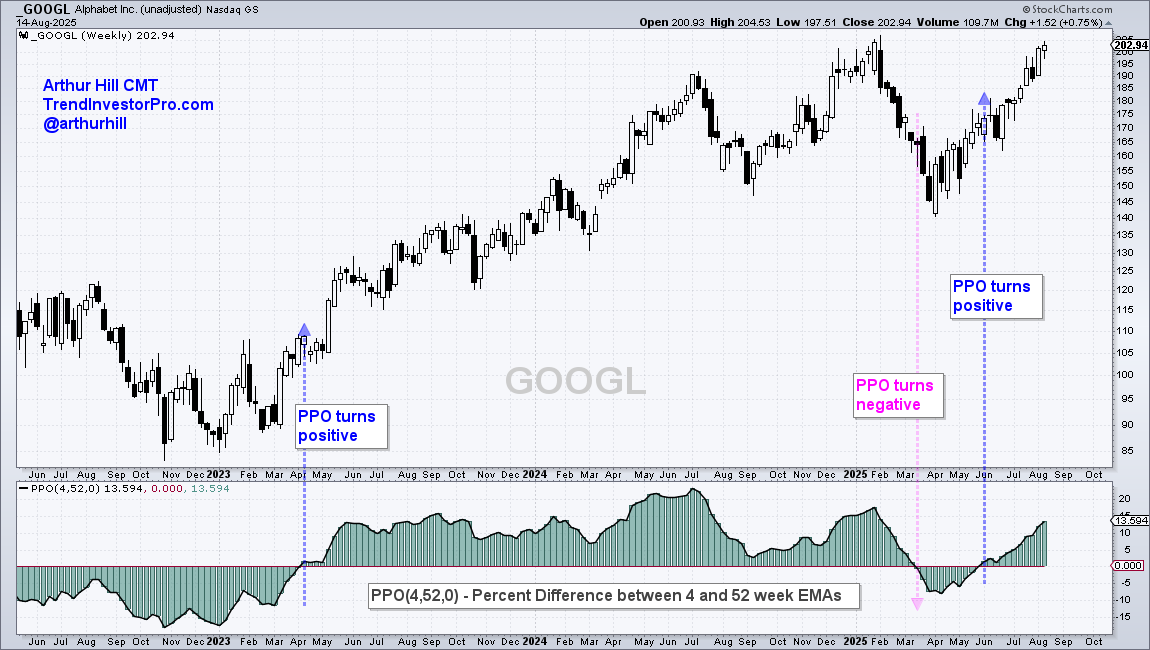
GOOGL is in a long-term uptrend and approaching the January-February highs on the price chart. The stock is perhaps short-term extended after a 22% surge in eight weeks. This condition could give way to a correction, pullback, or consolidation. Note that a pullback within an uptrend would create an opportunity, so we should keep GOOGL on our radar.
Recent reports and videos at TrendInvestorPro:
- Using the Zweig Breadth Indicator to Find Oversold Setups
- Market Regime Indicators Argue for Selective Bullishness
- AbbVie Leads within Healthcare - Plus nine more Stock Setups
- Regional Bank ETF Becomes Oversold and Bounces off Support
Click here to learn about subscriber bonuses and a trial offer.
When Do We Take Small- and Mid-Caps Seriously?
Short Answer: When new highs expand.
The chart below shows High-Low Percent for the S&P 500, S&P MidCap 400, and S&P SmallCap 600. High-Low Percent is the percentage of 52-week highs less the percentage of 52-week lows. It is positive when there are more new highs and negative when there are more new lows. My bullish threshold is +10% and my bearish threshold is -10%. Notice how High-Low Percent regularly exceeded +10% from December 2023 to November 2024 (blue shading). New highs remained strong throughout 2024.
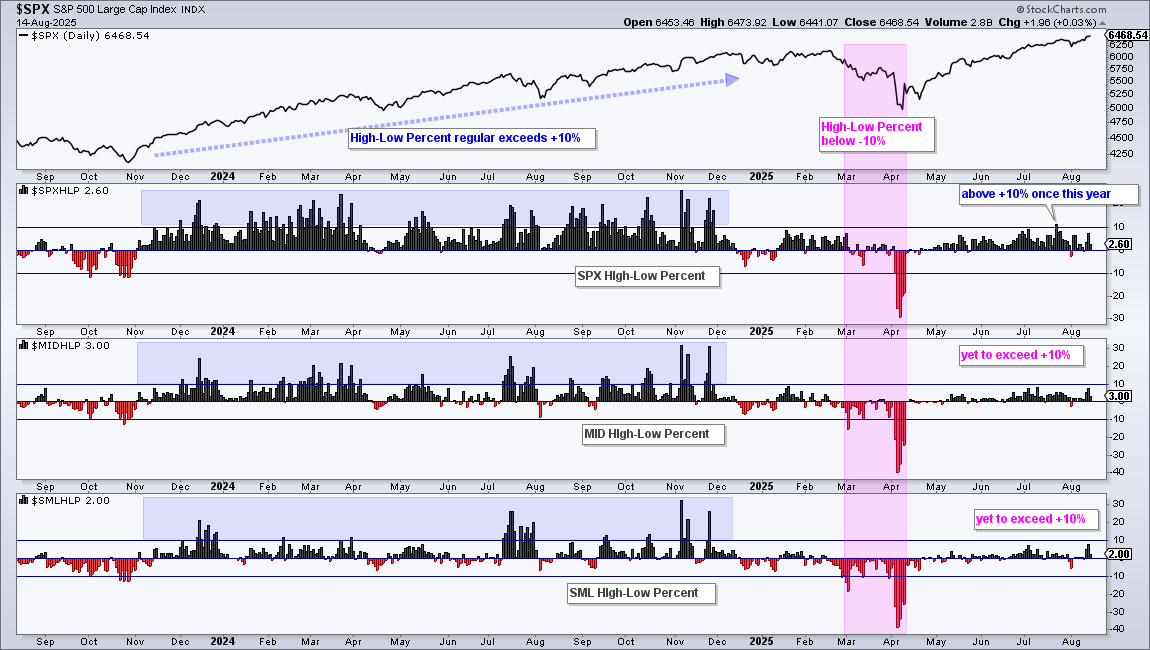
This indicator moved below -10% in March 2025 for the S&P SmallCap 600 and S&P MidCap 400 (pink shading), showing that new lows were significantly outpacing new highs. The surge off the April low was strong in price, but we have yet to see a serious expansion of new highs. SPX High-Low Percent exceeded +10% only once (July 23rd). MID High-Low Percent and SML High-Low Percent have not been above +10% since November 2024. Moves above +10% would show broadening strength in small-caps and mid-caps.
Which Groups Have the Most New Highs?
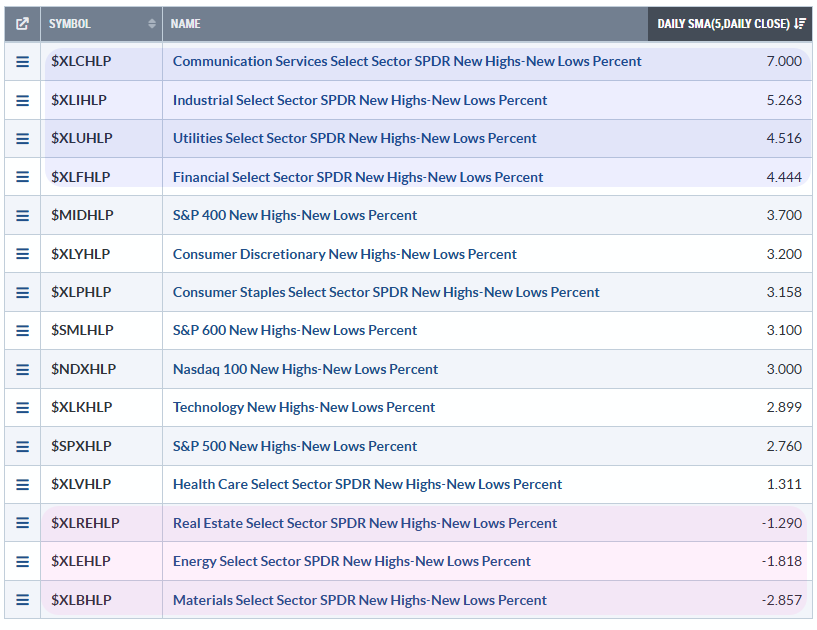
The image below shows a scan using a ChartList with the High-Low Percent indicators for the major indexes and sectors. This table is sorted by the 5-day SMA of High-Low Percent, which is the last column. Communication Services, Industrials, Utilities, and Finance are leading with the most new highs. REITs, Energy, and Materials are lagging because the 5-day SMA of High-Low Percent is negative, which means more new lows than new highs.
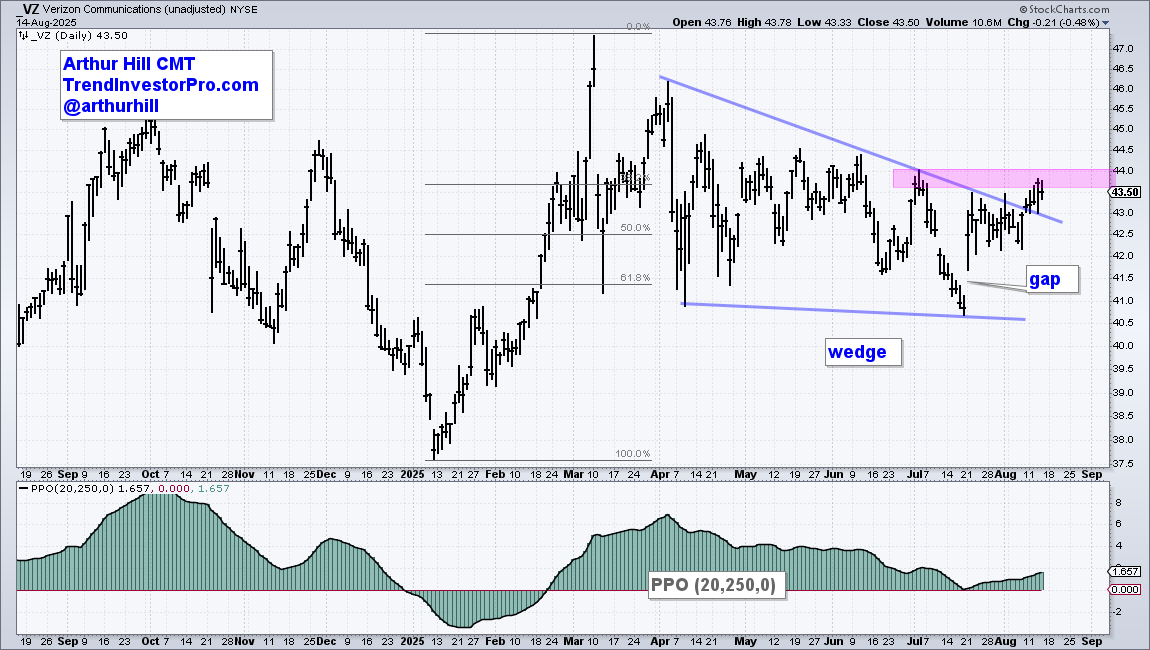
Verizon Goes for a Breakout
This Verizon (VZ) example below captures our bread and butter strategy at TrendInvestorPro. The group is strong, the trend is up and the stock is correcting within this uptrend. Our Premium Service features such setups for stocks and ETFs. Let's break it down.
The Telecom ETF (IYZ) is one of the strongest industry group ETFs because it recorded new highs this week. Verizon (VZ) is part of this group. Overall, VZ is in a long-term uptrend because the PPO (20,250,0) is positive. This means the 20-day EMA is above the 250-day EMA. After surging from early January to early March, the stock embarked on a correction with a falling wedge that retraced around 61.8% of the prior advance. This retracement amount is normal for a correction after a big advance, as is the falling wedge pattern. VZ surged in late July with a gap and broke the wedge line at 42 in early August. The early July high marks the last resistance hurdle to watch for a breakout.