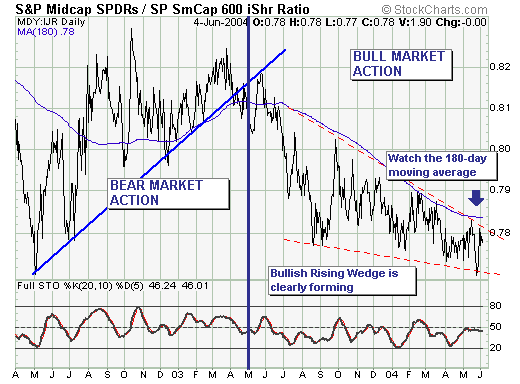
RISING WEDGE ON RATIO CHART BEARISH
Over the past two week's, sentiment has gone from "highly bearish" to "highly bullish" - a change in circumstances that shows confusion above all, but the fact remains the current rally in the major indices has reached the important 50%-60% retracement levels typical of countertrend rallies. Therefore, there is reason for caution at this junction, and we find other "esoteric" reasons for being so: a change in leadership between "mid-cap" and "small-cap" shares that has accompanied the transition from bearish to bullish to bearish markets. Quite simply, we use the S&P 400 and S&P 600 ETFs - MDY and IJR (exchange traded funds). In bear markets, MDY tends to outperform, in bull markets IJR outperforms. This brings us to our ratio chart, which is showing distinct signs of a "rising wedge" bottom formation, which would imply the current rally is in the process of "stalling" and will not reach new highs as many anticipate, but rather resume their recent trend towards lower lows. In our opinion, the determining factor is the ration breaking out above their 180-day moving average. Be prepared.