Hello Fellow ChartWatchers!
At the end of August, a very promising thing happened on the Dow Jones Industrials chart. Did you see it?
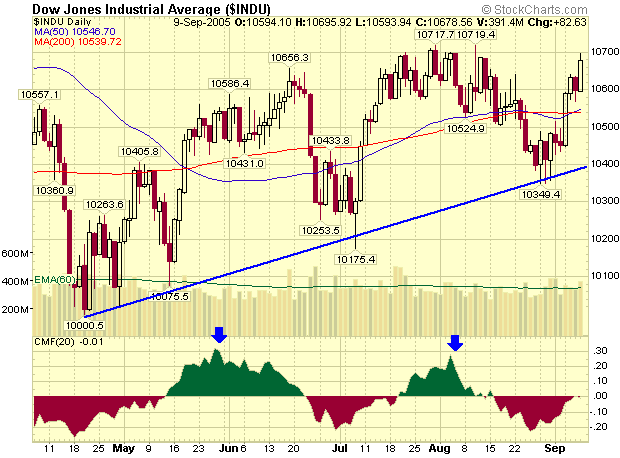
Last Thursday the index reversed around the 10,350 level. That confirmed the intermediate term uptrend (blue line) that goes back to the 10,000 low from last April. During this uptrend there have been two cycles between the three troughs - those peaks are clearly shown on the Chaikin Money Flow graph (blue arrows). If this pattern continues, expect to see the market rise until the CMF turns lower in a couple of weeks. But watch this chart closely folks! This week's test of 10,700 is key.


