Hello Fellow ChartWatchers!
This week the markets have started pushing into bullish territory. John, Carl and Arthur all dig into these new events in more detail, but first let's have a look at the S&P 500 Index:
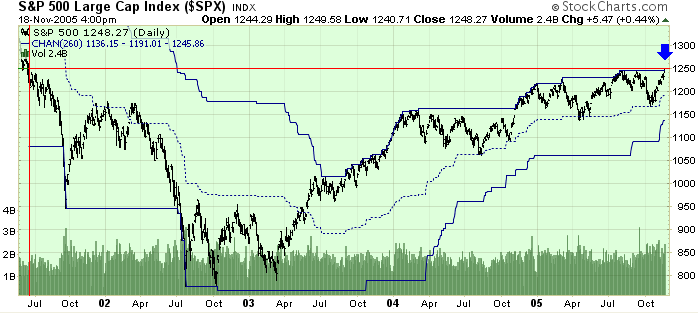
The blue arrow shows where the latest close, just below 1250, has broken the upper line on the 52-week (260 day) price channel - which is just a fancy way of showing that it set a new 52-week high. In fact, you have to go all the way back to June 15, 2001 to find the S&P 500 at this same level. Is this the big breakout we've been waiting for? Or is this just a temporary, soon-to-be-corrected oversold market condition? Even though it is a short week for the US markets, some important signals should appear - stay tuned!


