S&P 500 BREAKS ITS 50-DAY LINE
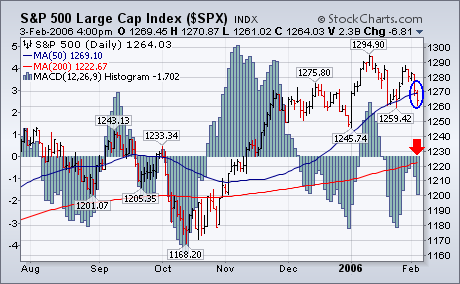
The chart below shows the S&P 500 closing the week below its 50-day moving average. That suggests a further drop toward 1245. The daily MACD histogram bars also paint a short-term negative picture. They stayed below the zero line and failed to confirm the previous week's price bounce before weakening even further this week. That only affects the short-term trend. It's the weekly trend that I'm more concerned about.