Net New Highs Expand to January Levels
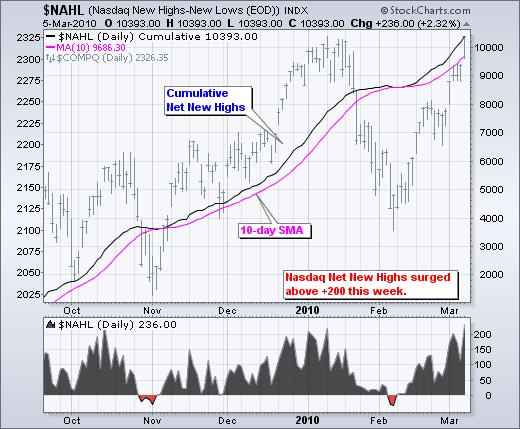
Net New Highs survived their third corrective period and surged over the last few weeks. The chart below shows Nasdaq Net New Highs surging back above +200 this week. Prior surges in October and early January hit the +200 area. Notice that there have been three corrections over the last eight months. Net New Highs dipped into negative territory in early July, late October and early February. These red areas are small as Net New Highs moved back into positive territory soon thereafter. In fact, notice that Net New Highs found support at or above -50 each time. This means we should expect a trend reversal if and when Net New Highs break below -50.

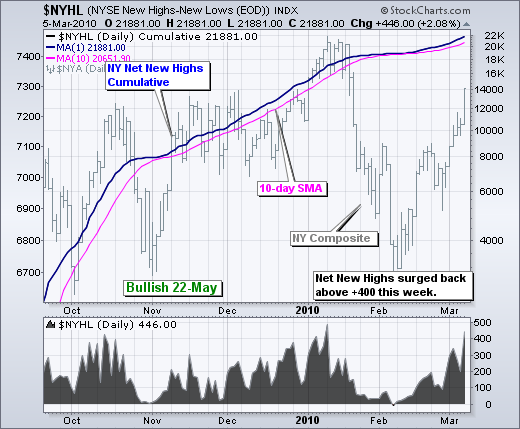
The next chart shows NYSE Net New Highs. Notice how this indicator bounced near the zero line in early July, early November and early February. Also notice that cumulative Net New Highs have been rising (above the 10-day SMA) for over 8 months. Even though Net New Highs are considered a lagging indicator, they have captured the current uptrend by staying largely positive. SharpCharts subscribers can click on these charts to see the settings and save to their favorites list.


