FIVE POSITIVES FOR THE DOW SPDR IN 2010
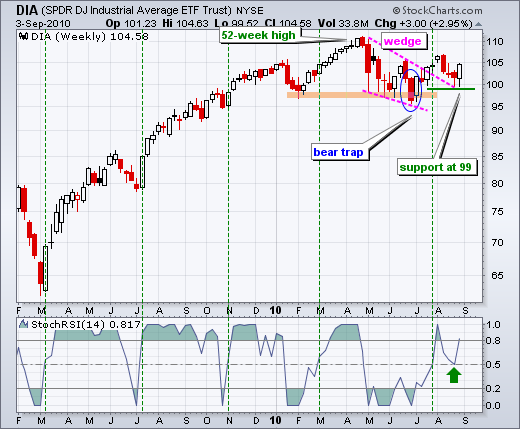
Stocks have been largely range bound throughout 2010, but the positives still outweigh the negatives overall. Chart 7 shows the **Dow SPDR (DIA)** starting the year just below 105 in January and finishing just below 105 this week. While it appears that DIA has nothing to show for eight months of trading, there are at least five (5) positives on this chart.

Click this image for a live chartWorking from left to right, DIA recorded a new 52-week high with the move above 110 in April (1). Despite a new high, the ETF then declined and broke its February low in late June. This seemed bearish at the time, but the ETF quickly recovered and surged back above 100 to create a bear trap (2). A falling wedge took shape and the ETF broke above wedge resistance in July (3). The uptrend was in good shape until a sharp decline in August knocked the wind out of the bulls. DIA ultimately held above the June low and reversed course around 100 this week (4). In fact, I would now label key support at 99. Also notice that StochRSI bounced off the .50 level (5). Looking back, we can see that pullbacks reversed as StochRSI moved above .50 and held above .50 (green dotted lines). This gives us two levels to watch in the coming days and weeks. The bulls have the edge as long as DIA holds 99 and StochRSI holds .50.


