PMO BUY Signals Reviewed From DP 152 Blue Chip Tracker Report
The DP Tracker reports are full of information on a variety of stocks and ETFs. Here is a link to a blog with more information on DP Trackers and how to find and use them.
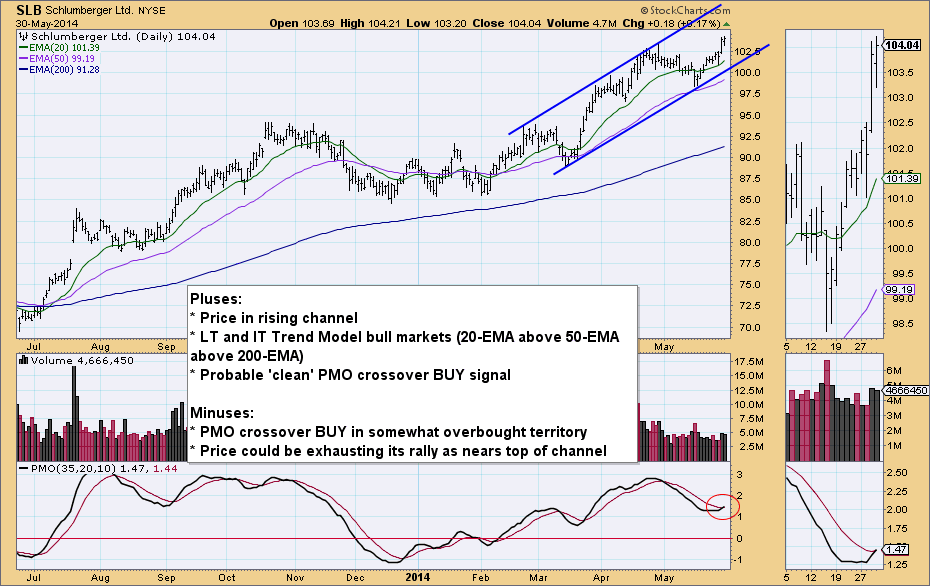
I took at look at Friday's DP 152 Blue Chip Tracker Report to find what stocks had gone on PMO crossover BUY signals. What is helpful about this report, especially the signal table portion, is if you find a stock with an interesting signal or strength ranking, you simply click on it to bring up the chart of that stock, ETF or mutual fund. Below is an excerpt of the PMO Crossover Signals table from the 152 Blue Chip Tracker. I'll pull up the five charts with new PMO BUY signals and give you my view of what the "Pluses" and "Minuses" are regarding those charts. I encourage you to visit the DP Trackers blog and try using a similar screening process to find candidates for review and possible action in our other DP Tracker reports.
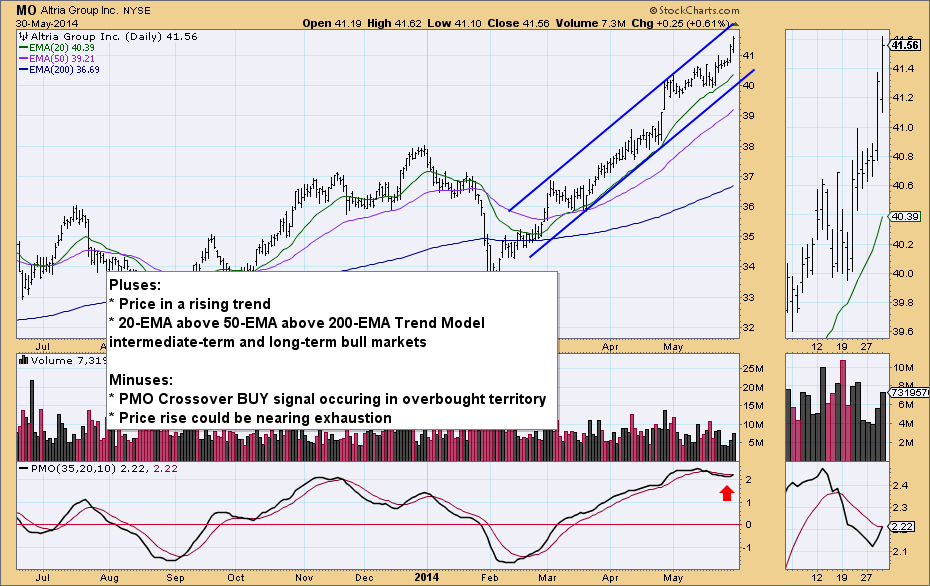
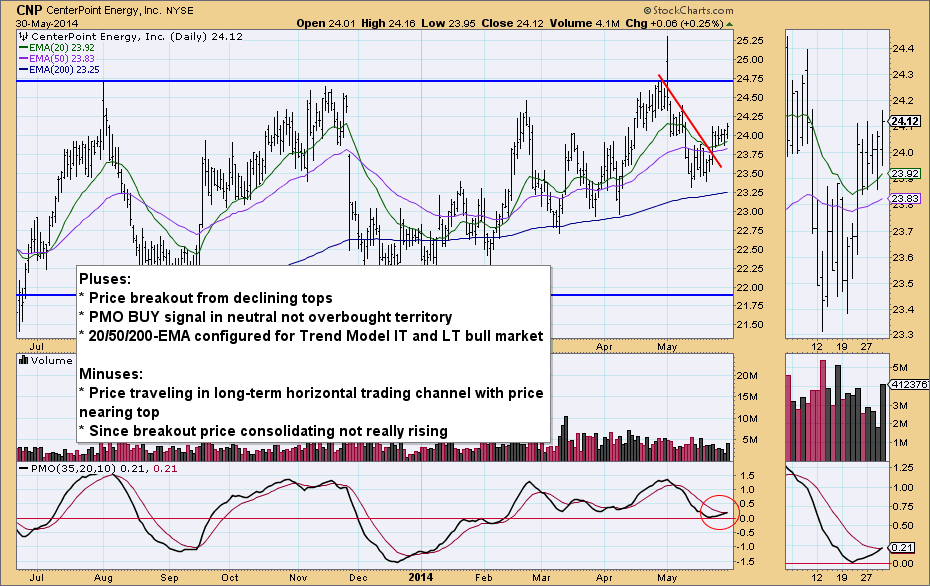
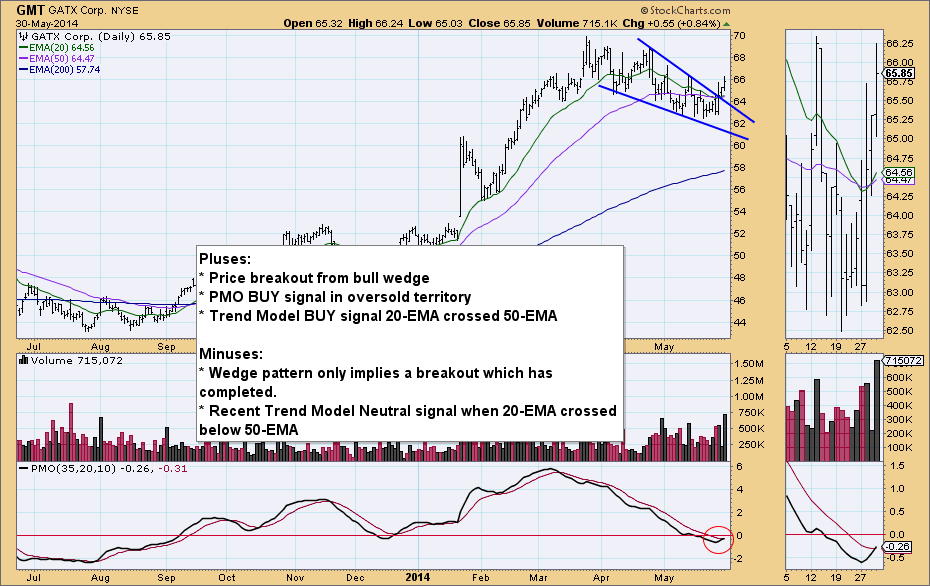
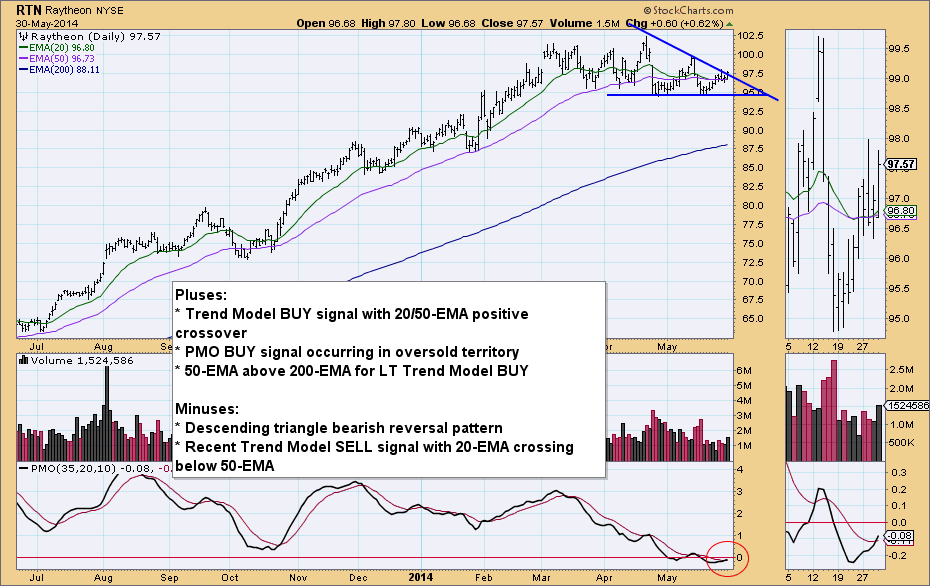
PMO CROSSOVER SIGNALS The PMO generates a BUY or SELL Signals when it crosses up or down through its 10EMA. These signals tend to be short-term in duration, but they can last for several weeks. Do not take them at face value because they can whipsaw quite a bit. They should be used to alert you to possible trading opportunities not used as a mechanical trading model. Always check our daily stock charts to verify the price pattern and the configuration of the PMO. Signals are best when price appears extended, is near support or resistance, SUMMARY OF PMO CROSSOVER SIGNALS DP152 DP152 BUY SELL Total Signals...: 101 51 % of Total......: 66% 34% Ave Days Elapsed: 17 18 Ave High Profit.: +4% +2% Ave Profit......: +3% 0% 05/30 Cal Close % Days High Today PMO Name/Symbol Price Change Signl Elap P/L P/L R/F Days ---------------------- ------ ------ ----- ---- ------- ------- -------- Altria Group MO 41.56 +0.6% BUY 0 0.0% -3.4% R 1CenterPoint Ener CNP 24.12 +0.2% BUY 0 0.0% -0.5% R 8GATX Corp GMT 65.85 +0.8% BUY 0 0.0% -1.2% R 2Raytheon RTN 97.57 +0.6% BUY 0 0.0% -1.6% R 7Schlumberger SLB 104.04 +0.2% BUY 0 0.0% -3.2% R 1Devon Energy DVN 73.90 0.0% BUY 1 0.0% 0.0% R 3FirstEnergy Corp FE 33.82 +1.0% BUY 1 1.0% 1.0% R 3General Motors GM 34.58 +0.4% BUY 1 0.4% 0.4% R 3Honeywell Intl HON 93.15 +0.3% BUY 1 0.3% 0.3% R 7Intel INTC 27.32 +1.3% BUY 1 1.3% 1.3% R 3Merck MRK 57.86 +0.3% BUY 1 0.3% 0.3% R 1
Happy Charting!
Erin


