Getting the Point of Point & Figure Charts
Hello Fellow ChartWatchers!
Over the past couple of weeks, we been revamping our Point & Figure charting tool. The new version was released last week. It has several key improvements including:
- You can now add up to 6 chart overlays per chart
- You can save your settings as the "Default" P&F settings and they will be used for all new P&F charts you create
- The parameter boxes for the various Scaling options now only appear when the corresponding Scaling option is chosen
- Price Objectives are controlled by the "Price Objective" dropdown. You can also turn off Price Objectives if you want
- Intraday P&F Charts no longer are forced to use the "ATR" scaling method
- Several predefined P&F ChartStyles are now available via the ChartStyles dropdown
- ... and much more.
Overall, the new P&F Workbench now has a "look & feel" that is very similar to the SharpCharts workbench. If you are familiar with using that page, using the P&F Workbench should be pretty straightforward.
Last Saturday, the ChartWatchers LIVE webinar was dedicated to demonstrating P&F Charts in general and the new workbench in particular. If you haven't seen the video of the webinar and you want to learn about P&F charting, I strongly encourage you to review that particular video. In it, you'll see why Point & Figure charts are one of my favorite analysis tools.
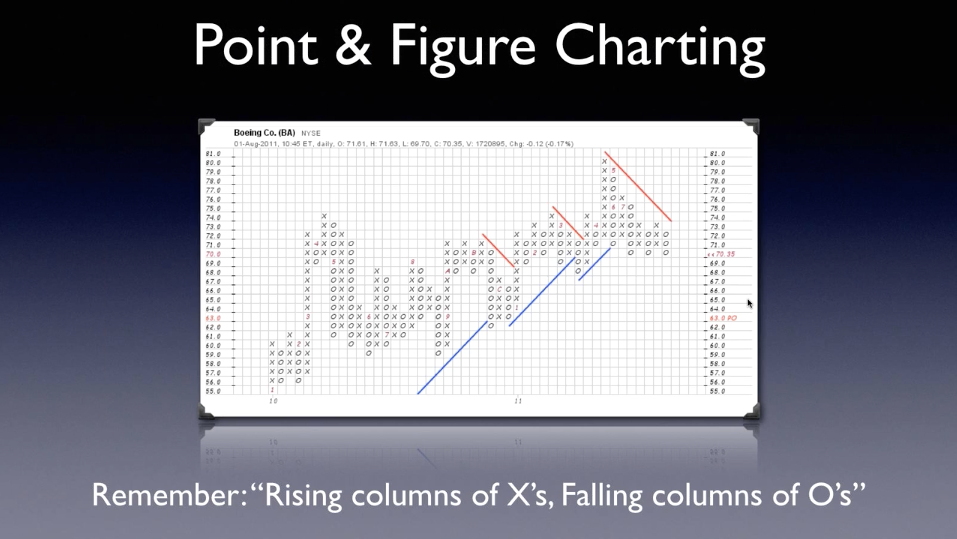
(Click on the image above to watch the video.)
Enjoy!
- Chip


