Using Correlations to Quantify the Effect of Rising Rates
Chartists can use the Correlation Coefficient to understand the relationship between Treasury yields and certain groups, such as banks, utilities and REITs. The chart below shows the 10-year Treasury Yield ($UST10Y) in the main window and seven correlations in the indicator windows. I am using weekly data, a 13-week Correlation Coefficient and a 26-week EMA for further smoothing. This extra smoothing is because I am simply trying to determine the general tendency. This is clearly not a trading vehicle, but rather an observation to be considered along with the price chart for each ETF. A positive correlation means the group tends to rise when the 10-yr yield rises. A negative correlation means the group tends to fall when the 10-yr Yield rises.
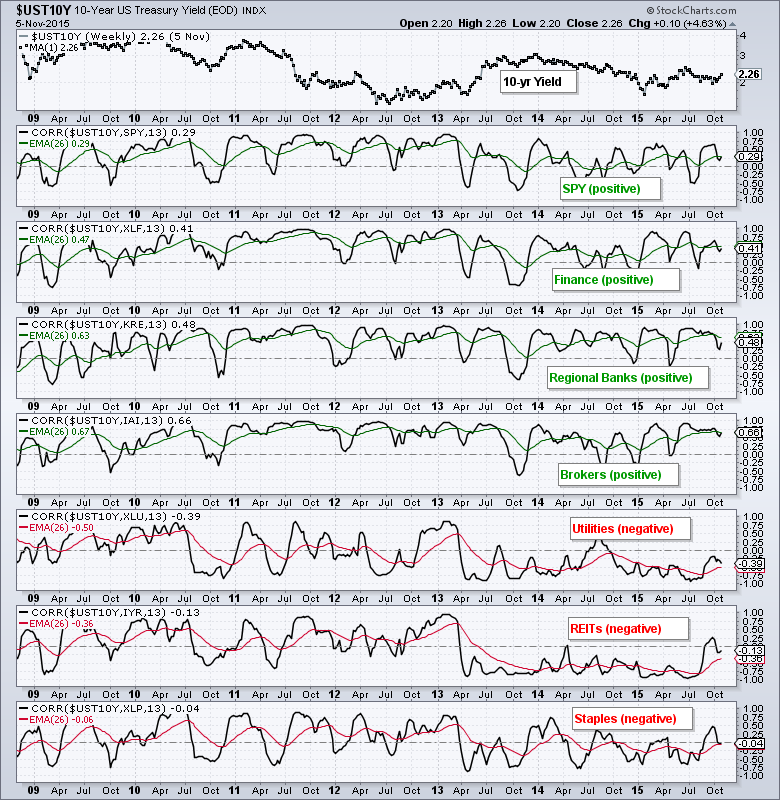
As the chart shows, the S&P 500 SPDR (SPY), Finance SPDR (XLF), Regional Bank SPDR (KRE) and Broker-Dealer iShares (IAI) are positively correlated to the 10-yr yield. This means they tend to rise when the 10-yr Yield rises and fall when the 10-yr yield falls. An uptrend in the 10-yr Yield, therefore, would be positive for the broader market, banks and brokers. On the other side, utilities, REITs and consumer staples are negatively correlated with the 10-yr Yield. This means they tend to rise when the 10-yr yield falls and fall when the 10-yr yield rises. A rising rate environment would be negative for utilities, REITs and consumer staples.
****************************************
Thanks for tuning in and have a good weekend!
--Arthur Hill CMT
Plan your Trade and Trade your Plan
*****************************************


