January Stock Rebound Continues
Editor's Note: This article was originally published in John Murphy's Market Message on Friday, January 18th at 11:01am ET.
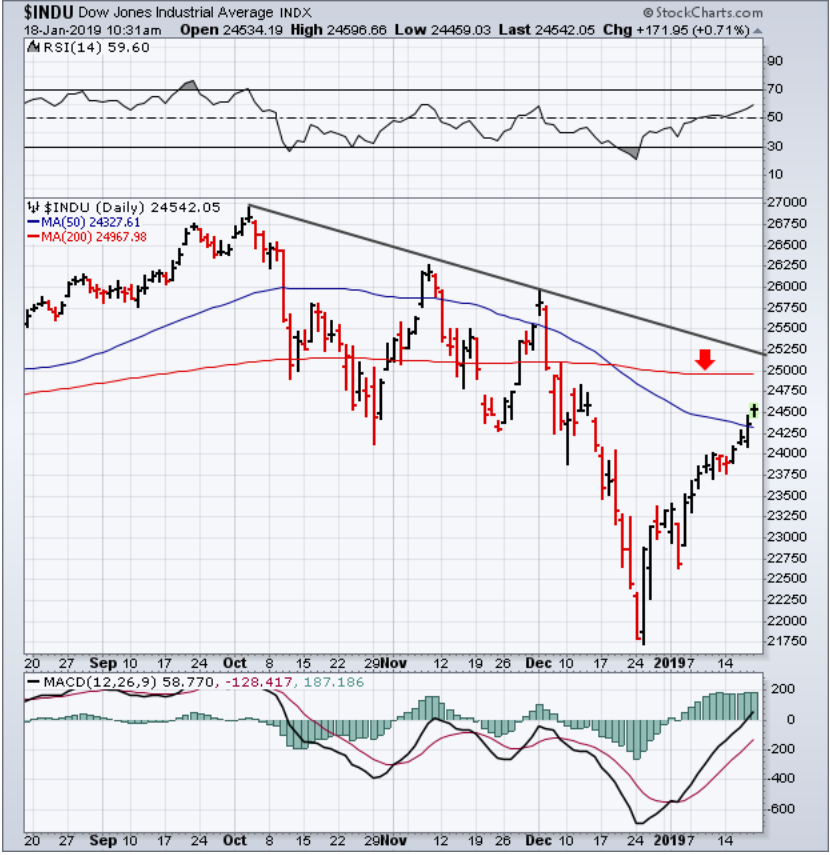
All major U.S. stock indexes have exceeded their 50-day averages (blue lines). That still leaves their 200-day averages to contain the rally. But there are a couple of other resistance lines that still need to be tested. Chart 1 shows the Dow Industrials nearing a test of their 200-day average (red arrow). In addition, the falling trendline drawn over its October/December highs should also provided stiff overhead resistance. The Dow would have to clear both barriers to signal a major turn to the upside. The same is true of the other two major stock indexes.
Chart 1


