Before You Cast Away, Hook the Market's Key Trends on StockCharts

Key Takeaways
- Monthly, weekly, and daily charts all show the S&P 500 riding above key moving averages.
- August tends to be the start of a historically weak period in the stock market.
- Tech leadership remains intact and could propel the stock market higher.
As July winds down, you might be wondering if it’s time for the classic “sell in August and go fishing” routine. Tuesday’s selloff may have caught some eyes, but, before you start hauling the tackle box out of the garage, let’s run a quick health check on the stock market.
What’s the Trend?
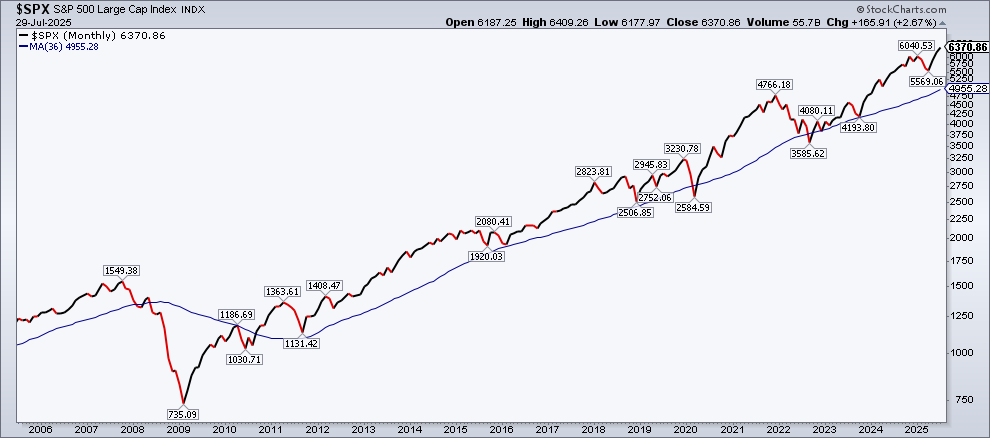
Start by analyzing the long-term trend. The 20-year monthly chart of the S&P 500 below shows the index is cruising comfortably above its 36-month simple moving average (SMA) with no signs of a pullback.
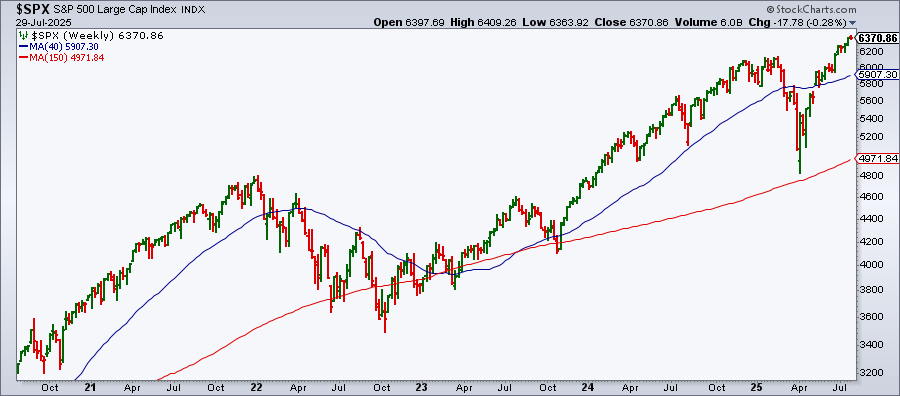
Next, switch to a weekly chart (see below) to identify the intermediate-term trend. The five-year weekly chart is more volatile than the long-term monthly chart, but, since May 2025, the intermediate-term trend in the S&P 500 has also been bullish. The S&P 500 is trading above its 40-week moving average.
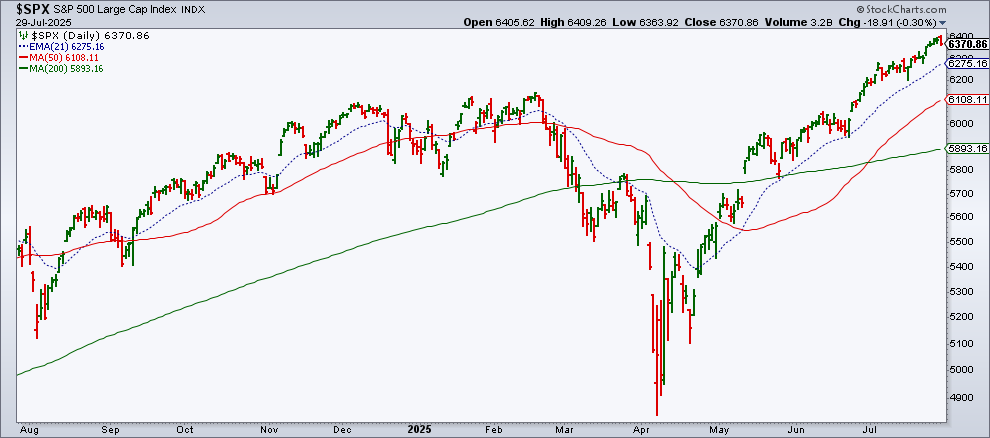
Let’s now turn to the short-term trend to see if it confirms the bullish movement of the long- and intermediate-term trends. On the daily chart below, we can see the S&P 500 is trading above its 21-day exponential moving average (dashed blue line), which is in a clear uptrend. The 50-day SMA is trading above the 200-day SMA.
All three timeframes confirm the uptrend. Should investors be concerned, given that we are now approaching a seasonally weak period in stocks?
Seasonality and Sentiment
There are a few signs of caution popping up, but they’re still in their early stages.
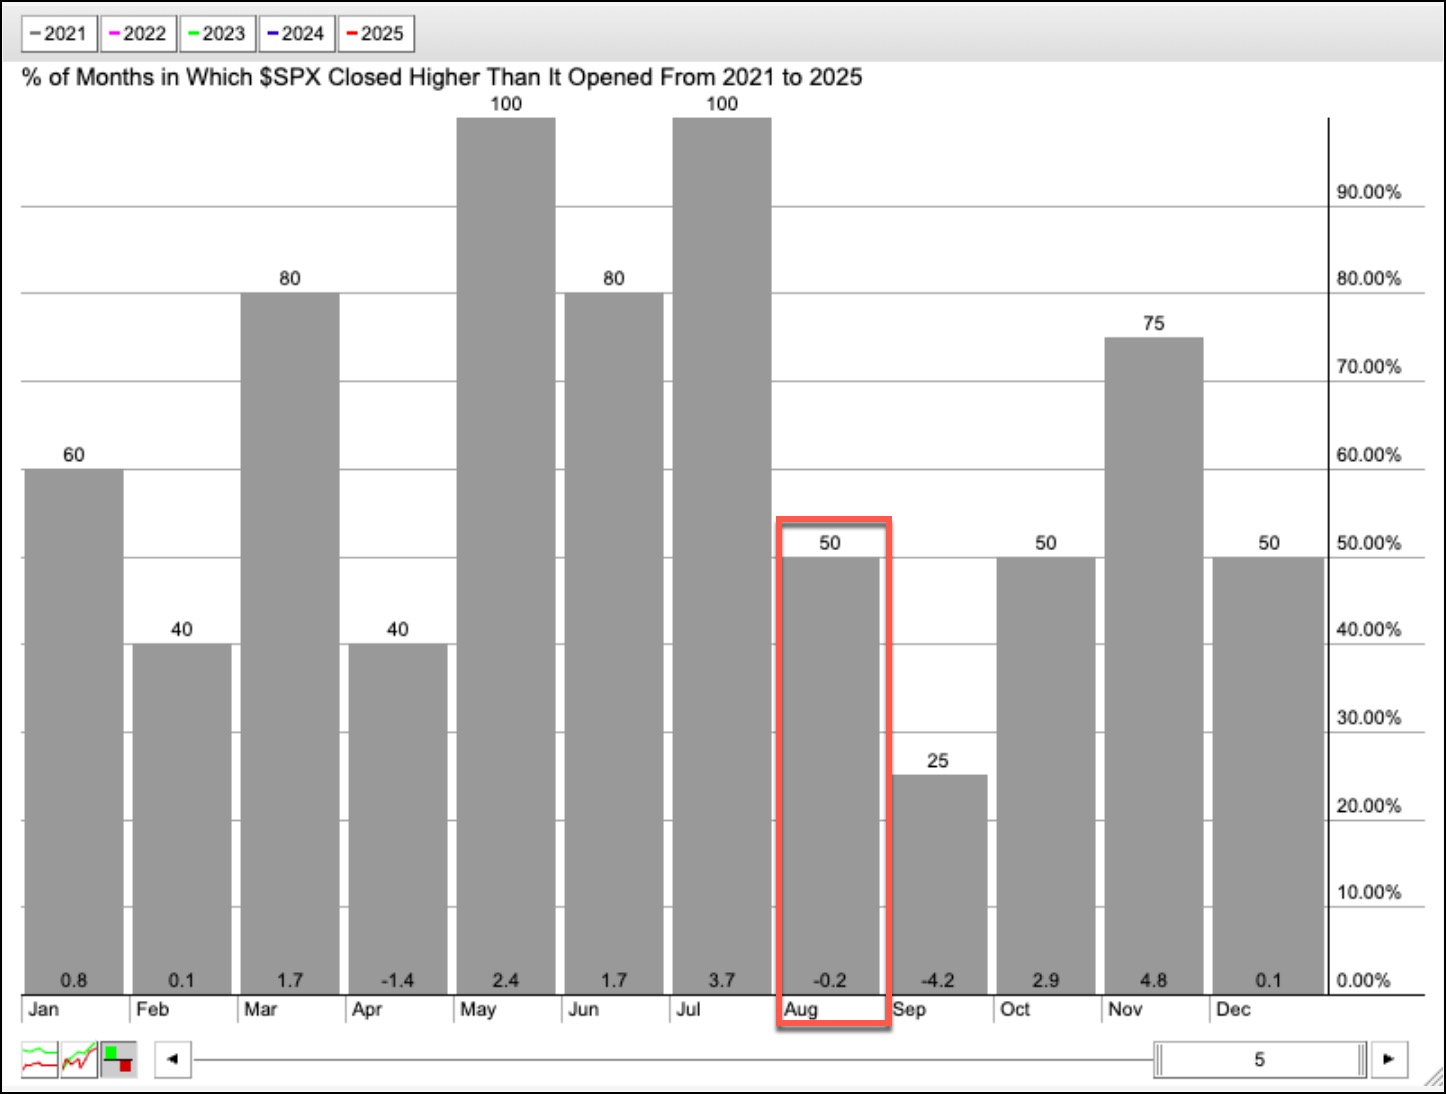
First on the list is seasonality. The seasonality chart of the $SPX below shows that in the last five years, in August, the index closed higher than it opened 50% of the time. The average return for the month is -0.2%. It’s not as great as July’s performance, but it’s hardly a reason to bail out.
In addition to seasonality, it’s worth looking at whether investors are complacent or getting nervous. Let's hop over to the Market Summary page and look at the Sentiment panel.
The Cboe Volatility Index ($VIX) dipped below 15 on Tuesday. This is often a sign that investors are getting too complacent. The VIX tends to be mean-reverting, so, when it hits extreme high or low levels, it is likely to revert to average levels, usually when the contrarian investors start entering the playing field. Fortunately, before Tuesday’s close, the VIX rose, closing above the 15 level (see chart below).
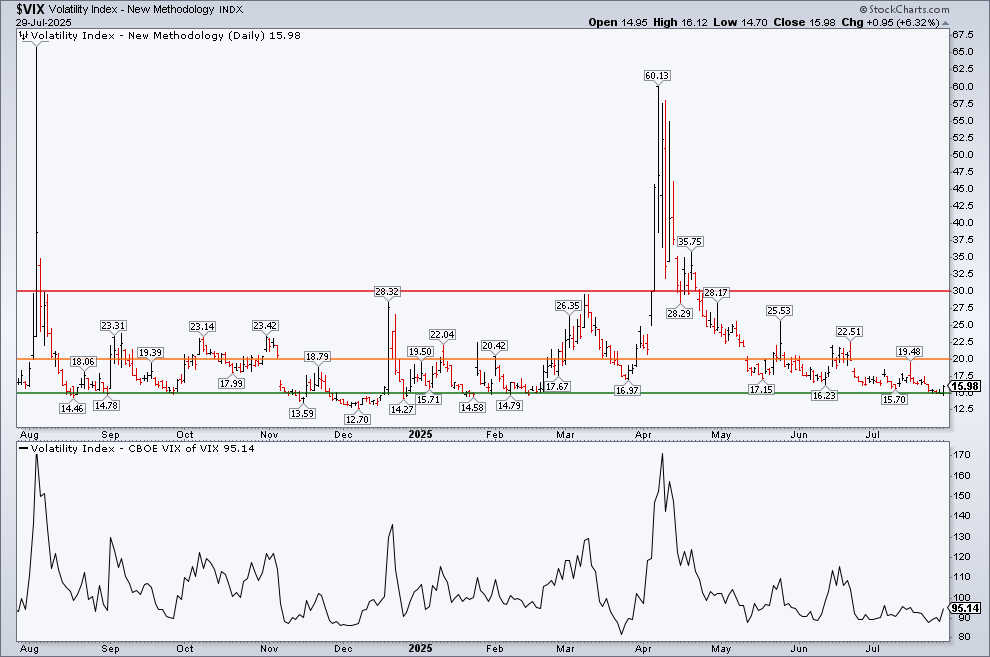
We’ve added the VIX of VIX ($VVIX) to the lower panel of the VIX chart. Note VVIX is at 95.14, an indication that the $VIX is starting to get a bit volatile. But that’s to be expected.
Wednesday is chock-full of data and earnings. We get the GDP report in the morning, the FOMC meeting in the afternoon, and earnings from mega-cap tech giants Meta Platforms, Inc. (META) and Microsoft Corp. (MSFT) after the close.
Tech stocks may have sold off on Tuesday, but, overall, they’re holding strong.
- The VanEck Vectors Semiconductors ETF (SMH) hit a new high, then pulled back, but still managed to eke out a record close.
- The Technology sector is the top one-month performer.
- The Nasdaq 100 ($NDX) and Nasdaq Composite ($COMPQ) are more than 11% above their 200-day SMAs.
With tech stocks still holding strong, and earnings from META and MSFT on Wednesday, followed by Apple, Inc. (AAPL) and Amazon.com, Inc. (AMZN) on Thursday, technology stocks could propel the overall stock market higher. This week’s price action will be important, so be sure to stay on top of it by regularly monitoring the Market Summary page or dashboard.
The Bottom Line
Even though we’re heading into a historically softer stretch, the trend is still your friend across monthly, weekly, and daily charts. Unless those charts do a quick turnaround, there’s little reason to abandon positions. Instead, make August a maintenance month by monitoring multi-timeframe trends, seasonality, and sentiment. That frees up your time to go fishing.