Turn Stock Market Dips Into Smart Trades with This Simple Scan

Key Takeaways
- Market pullbacks are a great time to take a step back and analyze charts, identify strong stocks, and build watchlists.
- The Sample Scan Library provides pre-built scans that help find stocks with technical setups aligned to your investing strategy.
- Save your scan results to a ChartList so you can monitor stocks over time, refine your list, and stay ready to take action when the market moves in your favor.
Market pullbacks can feel unsettling, but they don’t have to be. If you’ve got the right tools and mindset, a dip in the market can be a great opportunity to find promising stocks at better prices. The key is to wait for the dust to settle, be calm, and get strategic with your next moves.
Tuesday’s ISM Services pointed to weakness in the U.S. services sector. Add this to last Friday’s non-farm payrolls, and it’s leaning towards the Fed cutting interest rates a couple of times this year. We’re also entering a traditionally slower trading volume period, so it’s no surprise the markets are acting sluggish. The broader indexes are exhibiting signs of slowing momentum, but it’s not necessarily a bad thing.
This kind of environment gives you time to slow down and sharpen your technical analysis game.
Scan the Market to Spot Opportunities
A great way to stay active is to explore the StockCharts Scanning Tools. These will help you sift through thousands of stocks to find the ones that match your investing preferences and goals.
If you’re new to scanning, this is the easiest way to get started. Just head over to the Scans & Alerts tab and select Sample Scan Library, where you’ll find several pre-built scans to choose from. What’s even better is that you don’t require any coding skills!
Of course, choosing the right scan depends on what the market is doing. When momentum slows and the market looks a little shaky, one approach may be to look for oversold stocks. I prefer to look for strong stocks that are pulling back with the broader market, because these are the ones most likely to bounce back quickly when the tide turns.
A Scan Strategy To Try Now
Let’s look at an example. One scan I like to use is the “Moving Averages In Correct Order,” which identifies stocks and ETFs that are trending, but have temporarily pulled back toward either their 21-day exponential moving average or 50-day moving average, with a slowdown in momentum.
Focusing on the large-cap stocks that meet the scan criteria, here are the stocks that recently came up in my scan results:
- Close to or at the 21-day EMA. Citigroup, Inc. (C), Fastenal Co. (FAST), Gilead Sciences, Inc. (GILD), Interactive Brokers Group, Inc. (IBKR)
- Close to or at the 50-day SMA. Boston Scientific Corp. (BSX), Cisco Systems, Inc. (CSCO), Ford Motor Co. (F), HDFC Bank Ltd. (HDB), Hims & Hers Health, Inc. (HIMS), Medtronic, Inc. (MDT), Marathon Petroleum Corp. (MPC), Uber Technologies, Inc. (UBER)
Let’s break down a couple of charts.
Cisco Systems (CSCO)
After reaching all-time highs, CSCO pulled back to its 50-day SMA on Friday but recovered (see chart below). The stock is now consolidating.
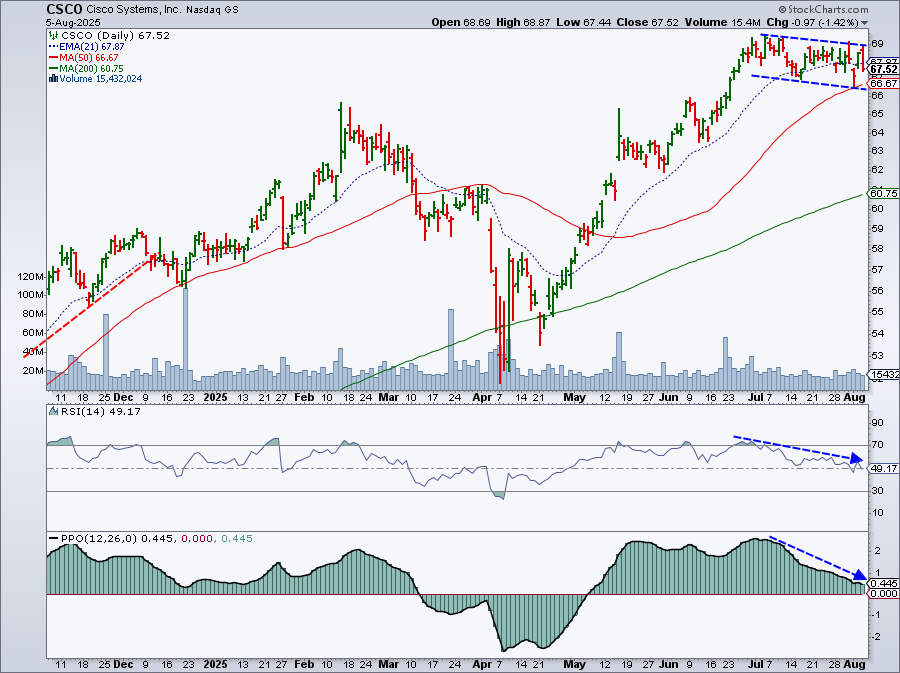
Momentum, as seen in the Relative Strength Index (RSI) and Percentage Price Oscillator (PPO), is slowing down. If the broader market continues to remain sluggish for the next couple of months, there’s a chance CSCO could retest its 50-day SMA and remain within its consolidation zone until the market makes a move in either direction.
Marathon Petroleum (MPC)
MPC hit a 52-week high on July 10 and has pulled back since then. Note the series of lower highs and lower lows (see chart below).
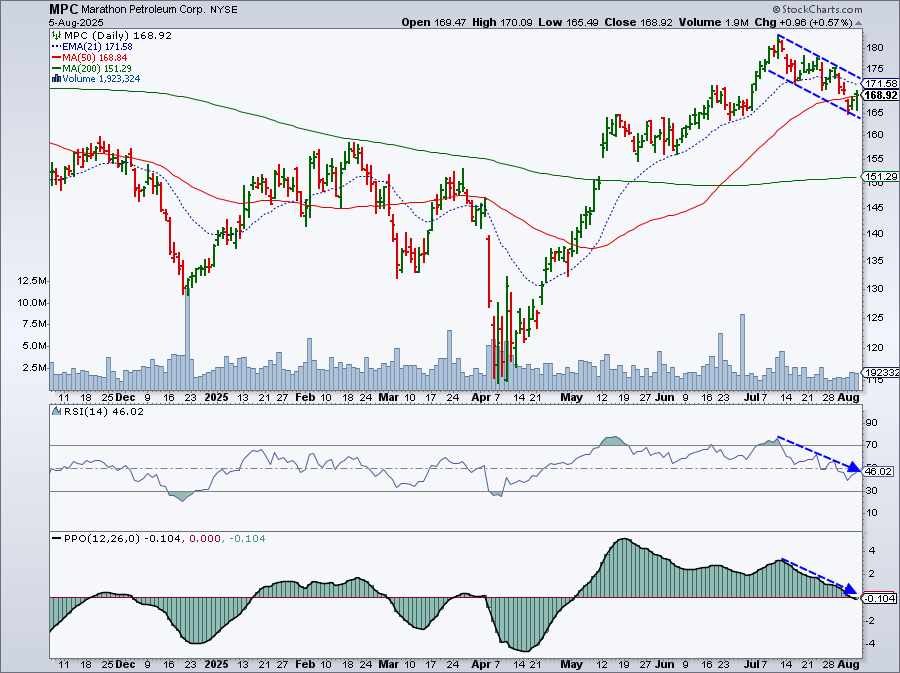
The stock price fell below its 50-day SMA, but recovered and is now in line with the moving average. Momentum has slowed down considerably. There’s a chance the stock could fall further, so it’s worth looking at a weekly chart to get a longer-term perspective of MPC, in order to determine if it has the potential to move higher.
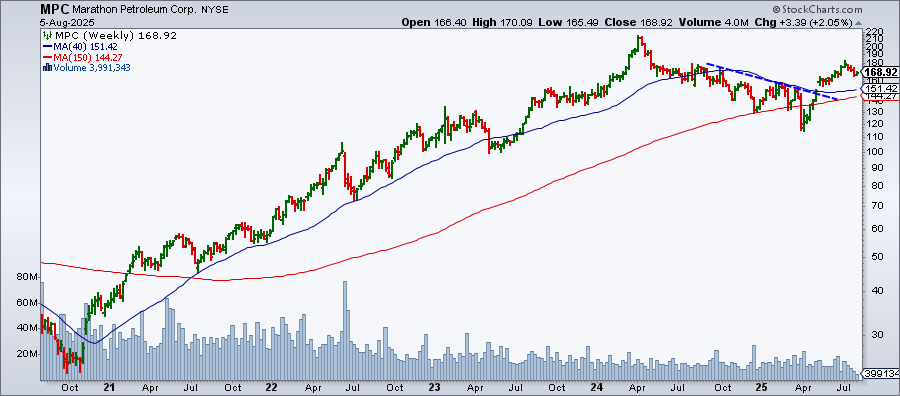
MPC broke out of its downward trend, although volume didn’t increase significantly. The stock is consolidating and could remain this way for the next few months. You may have to be patient, but this chart may be a good one to keep on your radar.
You could also save your scan results to a ChartList by clicking the Save to ChartList button at the top of the Scan Results page. This makes it easy to revisit the ChartList, filter through the stocks and ETFs at your leisure, and track the setups over time.
You've got the tools. Now's the perfect time to use them.
Become a Scan Expert
This is just one example of how you can put StockCharts Scans to work. Even if you’re not a coder, these tools can help you feel more confident about your investment or trading decisions. If you’re feeling adventurous, try tweaking the scan code. Pretty soon, you’ll be building custom scans from scratch using the Advanced Scan Workbench.


