Thursday's Stock Market Dive: Noise or a Warning? Let the Charts Decide

Key Takeaways
- While Thursday's dip may have felt like a warning sign, broader indicators suggest the longer-term trend remains intact.
- Look beyond price and track tools like the VIX, Bullish Percent Indexes, and key ratios.
- The Market Summary page helps you spot early signs of trend changes.
Thursday’s trading had all the ingredients of a turnaround. It was the final trading session of July, and that means the end of a seasonally strong period; perhaps some end-of-month portfolio rebalancing was at play.
Stocks fell in afternoon trading and closed lower, with the broader stock market indexes closing lower for the day. Thursday’s PCE data came in a tad hotter than expected. Earlier in the week, the GDP report showed that the U.S. economy grew at a solid 3% clip in Q2. (Well, that just dampened the probability of a Fed rate cut decision in September.)
Signs of a Resilient Economy
Overall, we are seeing signs of a strong economy. Take the U.S. Dollar Index ($USD), for instance. It hit a low of 96.38 on July 1, a level we haven’t seen since 2022. Now, the dollar is clawing its way back. It now sits above its 50-day simple moving average (SMA). Could this be a sign of renewed strength?
Similarly, bond prices are also recovering, while precious metals are cooling off. Overall, this type of price action supports the case for a growing economy.
A selloff like the one we had on Thursday is enough to spook investors. So, how do you separate noise from real signals? This is where factors such as sentiment and market breadth indicators can help confirm if the bullish trend is still intact.
What Are the Charts Telling Us?
Head over to the StockCharts Market Summary page and start with the Equities panel. If you sort by the +/- SMA(200) column, you’ll see that the Nasdaq Composite ($COMPQ) is leading the charge. It’s over 11.26% above its 200-day SMA. On the flip side, only the Dow Transports and the S&P 600 (small caps) are lagging below their 200-day SMAs. All indexes are trading above their 50-day SMA, though some are trading below their 20-day exponential moving average (EMA). This suggests that the longer and intermediate-term trends are still up, while the shorter-term trend may be making investors a little jittery.

What’s the Mood?
Scroll down to the Sentiment panel and take a look at the chart of the Volatility Index.
The Cboe Volatility Index ($VIX) jumped higher on Thursday, but it’s still below its 20 level threshold. The expected volatility of the VIX ($VVIX) is also getting higher, but not yet at a level to panic. This was a big earnings week for the mega-cap tech stocks, so it’s not unusual to expect higher volatility.

Meta Platforms, Inc. (META) and Microsoft Corp. (MSFT) reported strong quarterly results. Apple, Inc. (AAPL) and Amazon.com, Inc. (AMZN) reported better-than-expected earnings, although Amazon’s guidance came in light.
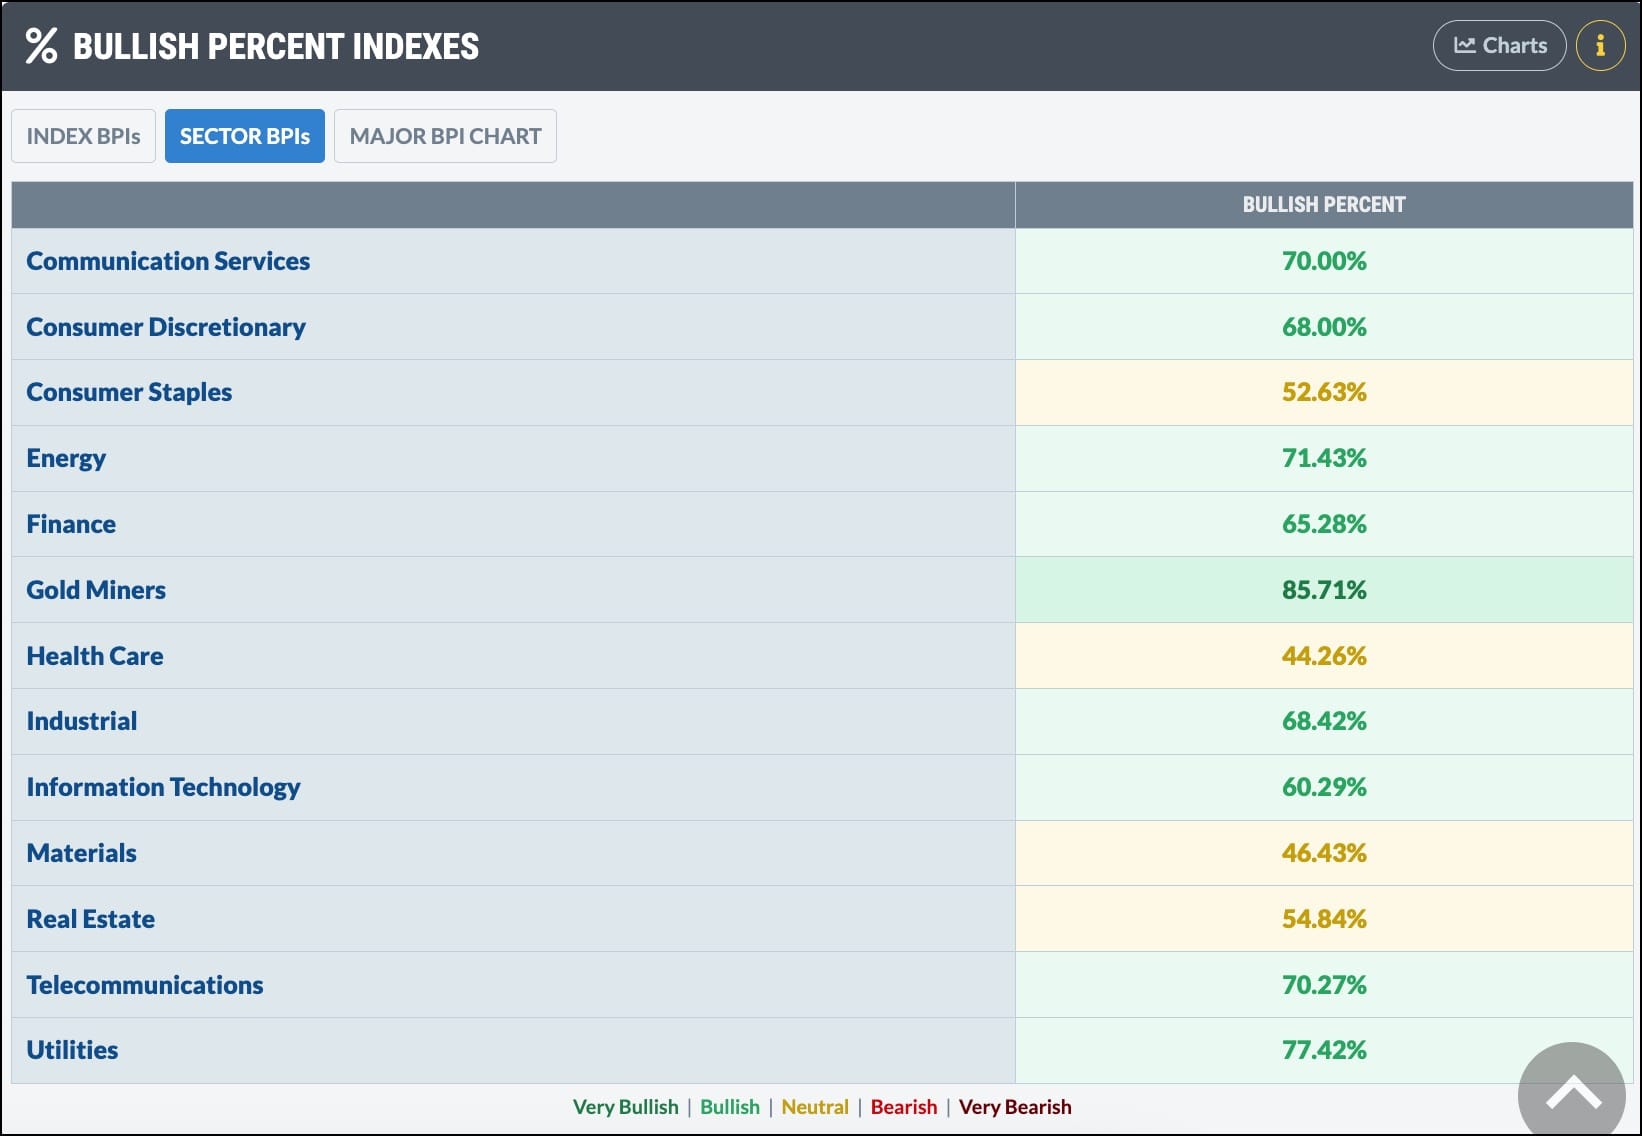
The %Bullish Percent Indexes panel paints mostly a positive picture. All indexes and sectors are holding in neutral or bullish territory.
A peek at the New Highs and New Lows panels shows that more stocks in the Nasdaq and S&P 500 are hitting new 52-week highs versus 52-week lows.
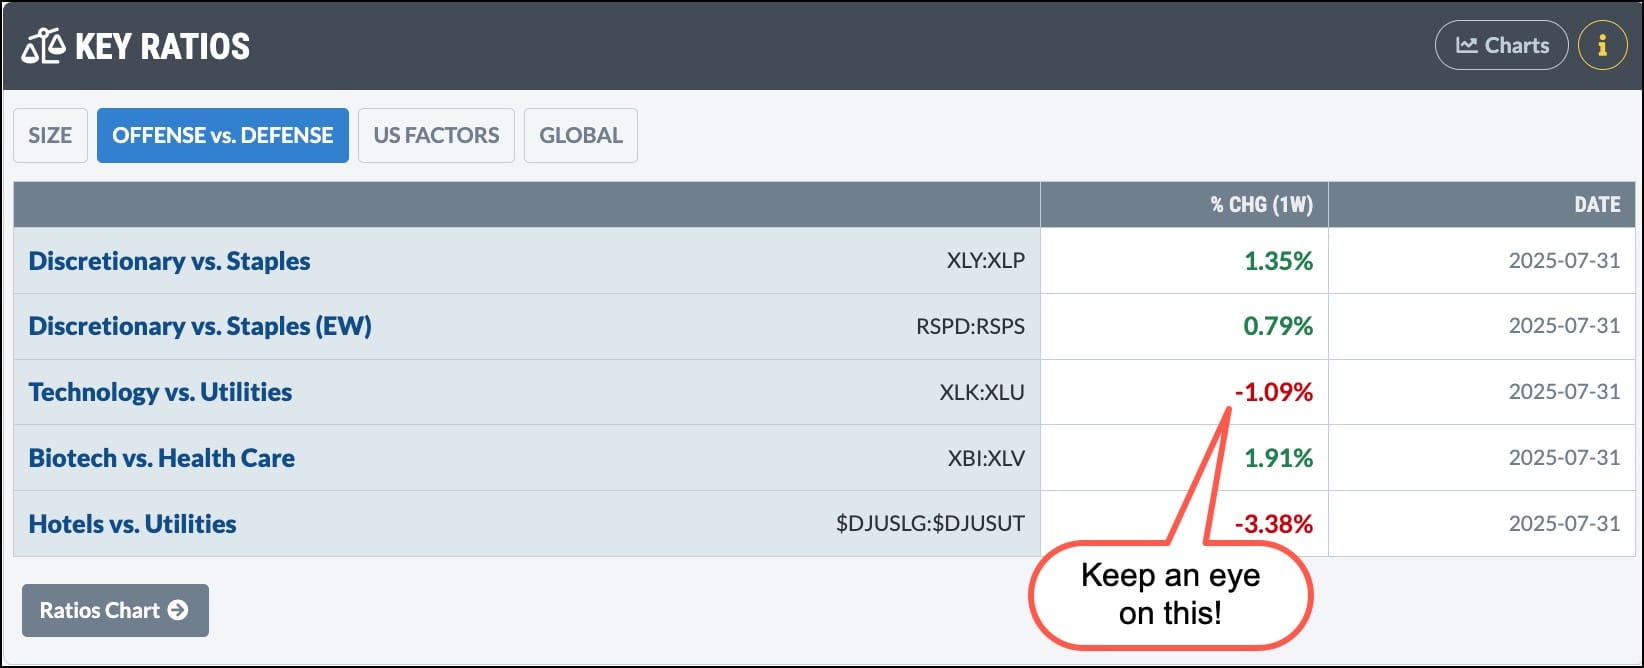
The Key Ratios panel shows that over the past week (select One Week from the timeframe dropdown at the top left), Consumer Discretionary is outperforming Consumer Staples, which suggests investors are in offense mode. However, Technology is underperforming Utilities, which suggests the opposite — investors are becoming more defensive. This is something to monitor closely.
Another area to watch closely is the performance of small-cap stocks. This asset group has begun to show signs of breaking down. The stock market is sending mixed signals, which is not uncommon at an inflection point.
Final Thoughts
On Friday, we get the July jobs report before the open, which could be the market-moving event that ends the trading week.
Before the market opens, pull up the StockCharts Market Summary page to check in on the market’s overall trend, investor sentiment, breadth indicators, and sector rotation using the respective panels.
When it comes to the stock market, it’s never a smooth ride, and we may be getting a little bump as we head into August.
Ready to spot opportunities and avoid the noise?