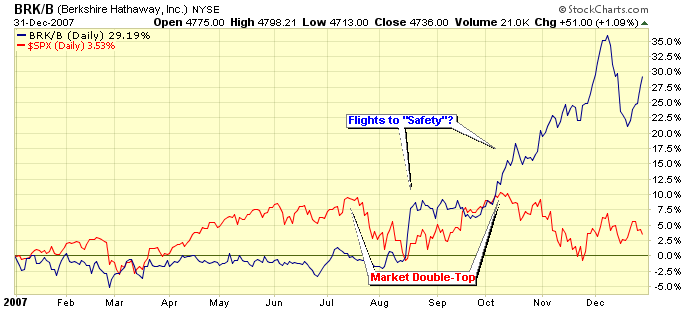
Berkshire's "Flight to Safety" Breakouts (BRK/B)

Click here for a live version of this chart.
Continuing to look for "leading" technical signals that pointed to the market's recent crash. It's always interesting to see how the country's "best" investor did. Warren Buffet's Berkshire Hathaway had a couple of interesting jumps in its stock price during the period in question. Comparing the percentage performance of BRK/B to $SPX, we can see two big jumps in 2007 (chart above) and one jump in 2008 (chart below). Of course, not all jumps in BRK/B are signs of an impending crash - but these charts show that they shouldn't be ignored either.

Click here for a live version of this chart.


