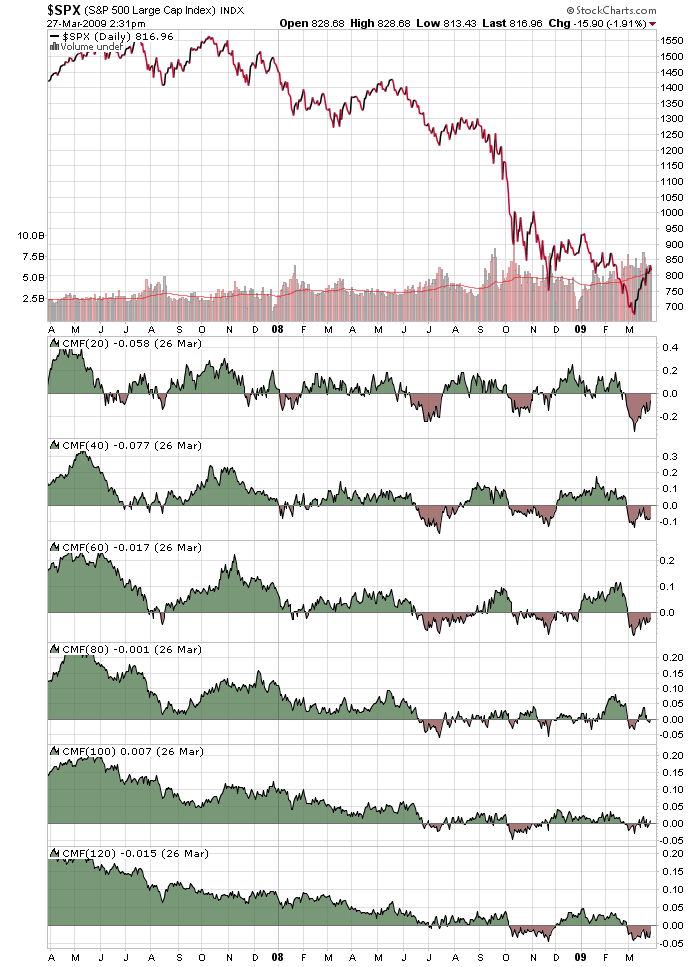
Chaikin Money Flow Study ($SPX)

Click here for a live version of this chart.
Often we get asked "What settings should I use on my indicators? What's the best?" and our answer is the always infuriating "It depends." The chart above shows why "It depends" is always going to be our answer.
I've added six different versions of the Chaikin Money Flow (CMF) indicator to this chart of the S&P 500. Notice the different frequency with which the CMF lines cross the zero line and turn red. The shorter the frequency, the more often (in general) the CMF turns red.
What's interesting on the chart above is all the whipsawing done by the 80-day CMF between July 08 and February 09 - and by tge 100-day CMF in March 09. Very unusual.


