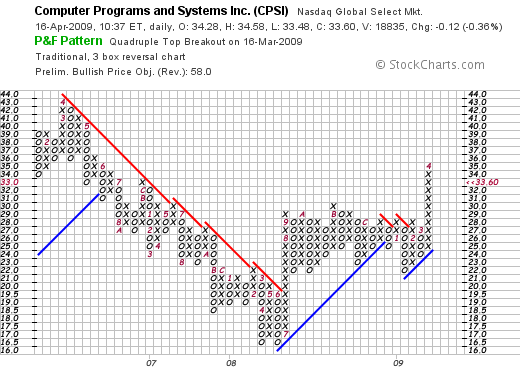
Quadrupal Top Breakout Now Faltering (CPSI)

Click here for a live version of this chart
CPSI has had a pretty impressive P&F chart for a while now. On March 16th, it completed a Quadrupal Top Breakout pattern that is, technically, still in place today. The problem is that CPSI is dangerously close to reversing right now with the potential to fall back below that huge support/resistance level at 29-30.
The key for this chart is to see if CPSI can remain above 33.0 (see the red number of the _left_ side of the chart?). If it can, the breakout will remain valid. A quick glance at the Candlestick chart however reveals that things don't look promising:

Click here for a live version of this chart
The volume picture in particular points to a breakout that is running out of steam and is ripe for some profit taking. Still, CPSI has made an impressive move that is worth watching closely.


