Info from the Bollinger Band Scan
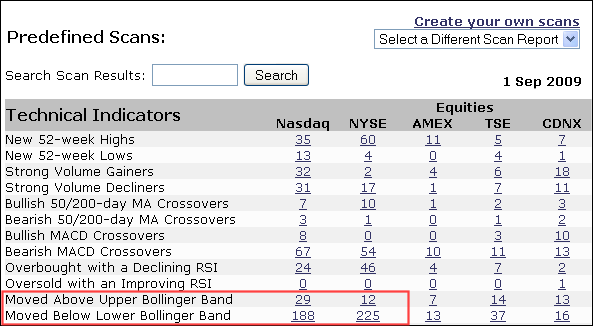
Stockcharts.com provides a number of pre-defined scans using classic indicators. In particular, I always keep an eye on the Bollinger Band scan that shows stocks moving above their upper band and stocks moving below their lower band. Selling pressure is picking up as many more stocks moved below their lower band on Tuesday, September 1st.

Click this image for more details.


