Renko charts filter the noise
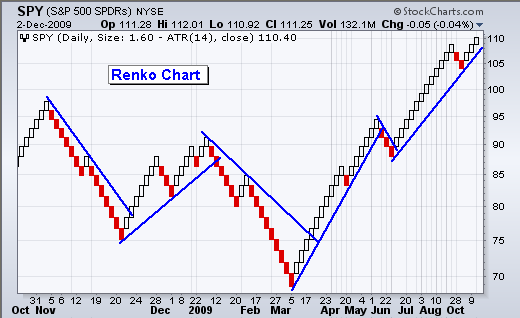
The chart below shows a Renko chart for the S&P 500 ETF (SPY). Like Point & Figure, these charts focus on price action, independent of time. Notice that the first half of the chart extends from late October 2008 to early March 2009. The second half extends from early March to early December. A big uptrend is underway with trendline support at 108.


Click this chart for details
Renko charts are available under "Chart Attributes" and "Type. You can also adjust the ATR to change the size of the Renko boxes, which affects the reversals.


