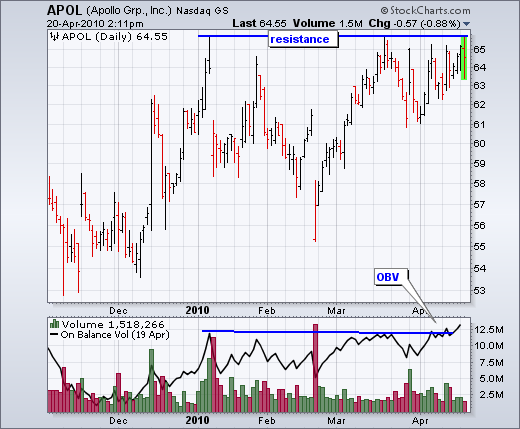
APOL consolidates near resistance
The chart for Apollo Group (APOL) sports a consolidation pattern that looks like an inverse head-and-shoulders. Resistance in the 65-66 area stems from reaction highs in January-March as well as the consolidation in April. A break above these highs would be bullish. Notice that OBV already broke resistance.

Click this image for a live chart.


