Dr. Elder's Take on Last Week's Volatility
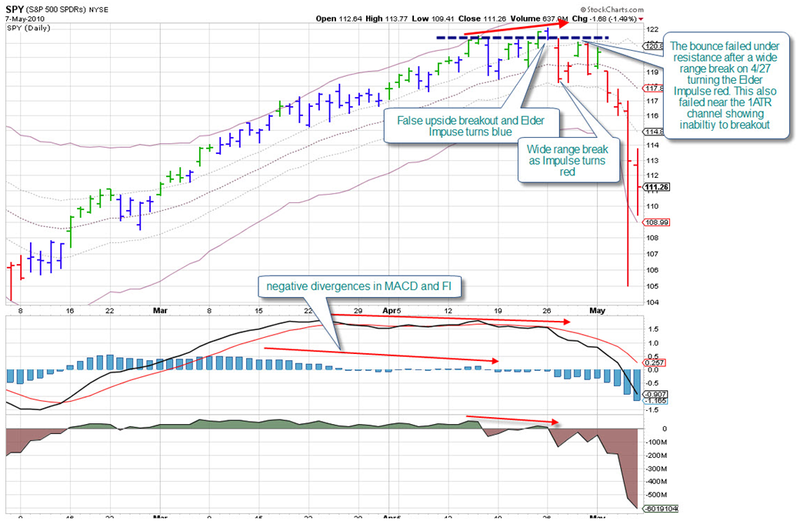
Alexander Elder and his partner Kerry Lovvorn put together this chart analysis of last week's market action:

Click here for a live version of this chart.
The chart uses our new version of Dr. Elder's Impulse Trading System to color the bars. "FI" refers to the "Force Index" which is the lowest indicator on the chart. You can see more of their work at SpikeTrade.com.


