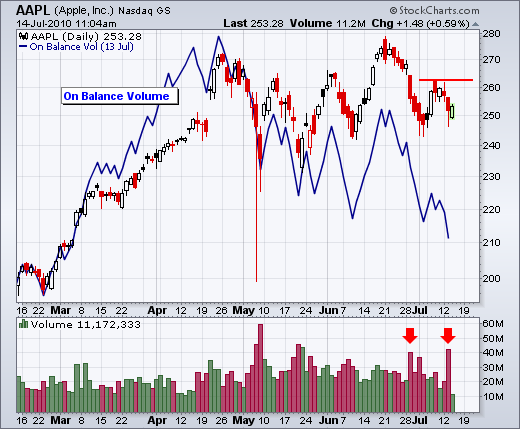
Selling Pressue in OBV for Apple
The Apple chart shows signs of increased selling pressure with a steady decline in On Balance Volume (OBV) the last 2-3 months. OBV peaked in mid April, formed a lower high in late June and moved to new lows in July. With Apple (AAPL) hitting a new high in late June, a large bearish divergence is taking shape in OBV. Also notice the volume on down days is consistently higher than volume on up days.

Click this image for details


