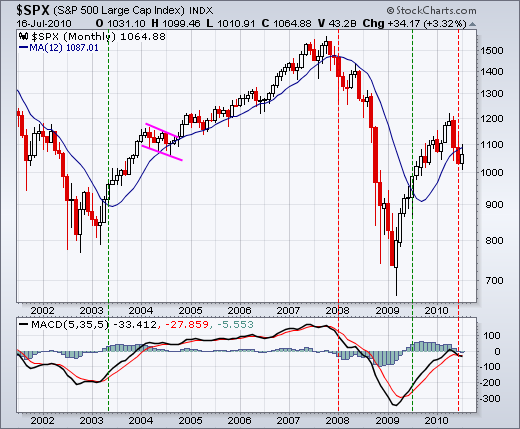
S&P 500 breaks 12-month moving average
The monthly chart below shows the S&P 500 holding its 12-month moving average throughout long-term moves over the last 9 years. A decisive close above or below this 12-month moving average has been indicative of a long-term trend change, which occurred last month. Also notice that MACD(5,35,5) moved below its signal line and into negative territory.

Click this image for details


