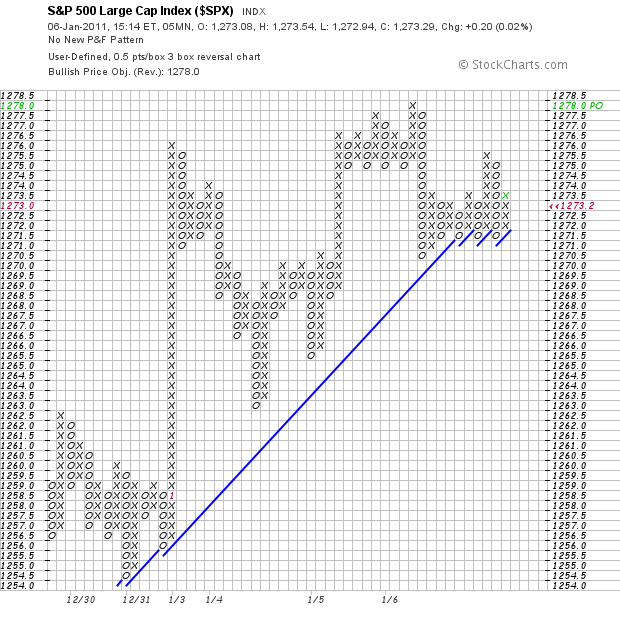
Marking Support with the 5min P&F Chart for SPX
Even though this is very short-term oriented, the 5 minute P&F chart for the S&P 500 shows a clear support level around 1270. The ETF bounced off this area at least five times today. A break below would argue for some sort of short-term pullback. Keep in mind that this chart only covers six trading days.

Click this image for a live chart


