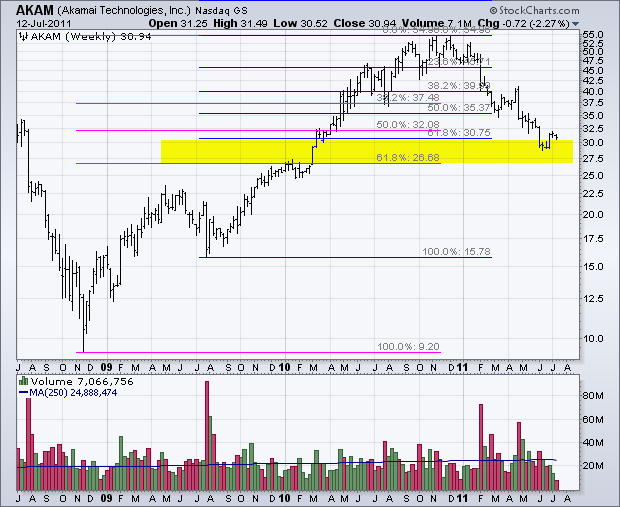
AKAM Hits Fibonacci Cluster Zone
The Fibonacci Retracements Tool can be used to identify Fibonacci levels to estimate support, resistance or turning points. When there is more than one advance, chartists can apply this tool to both moves and look for a cluster zone. The chart for Akamai shows the Fibonacci Retracements Tool extending from the November 2008 low and from the July 2009 low. The 61.8% retracements cluster in the 26.68 to 30.75 area to mark potential support.

Click this image for a live chart


