QQQ Gets Cold Feet at Resistance
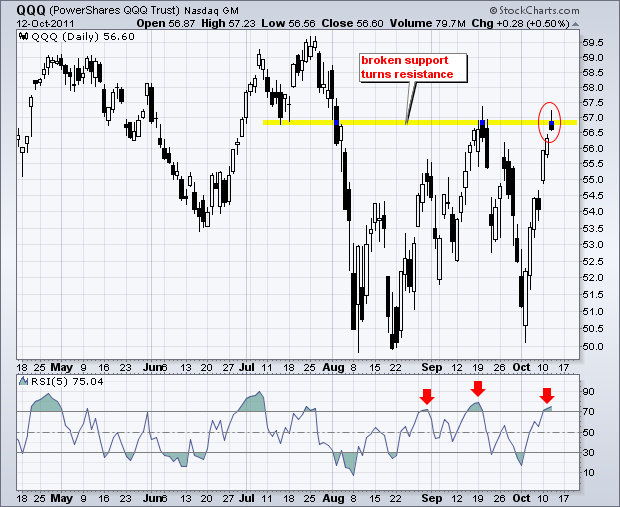
The Nasdaq 100 ETF (QQQ) surged all the way to its September high and formed a small black candlestick with a modest upper shadow on Wednesday. This shows that the ETF moved above 57 intraday, but failed to hold these gains and closed near the low for the day. The 57 area marks resistance and 5-period RSI is overbought for the third time since late August.

Click this image for a live chart


