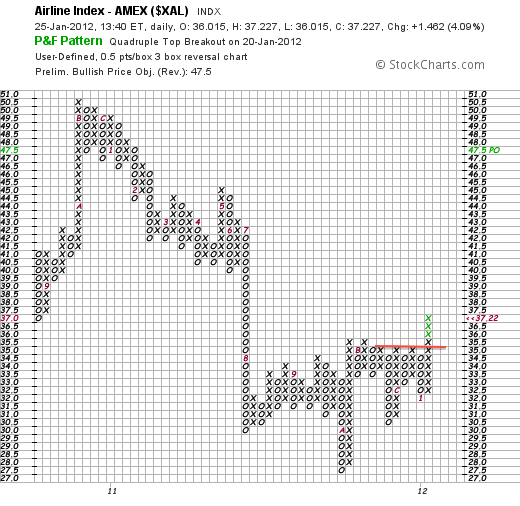
Amex Airline Index Forges Quadruple Top Breakout on P&F Chart
The Amex Airline Index ($XAL) lagged the market throughout 2011, but may be poised to lead with a breakout in 2012. The P&F chart below is a classic three box reversal chart with each box representing 50 cents. Notice that the current X-Column broke above the last three to forge a Quadruple Top Breakout with an upside price objective at 47.50. You can read more on P&F patterns and price objectives in our ChartSchool.

Click this chart for a live image


