Nasdaq Forms Huge Double Bottom on P&F Chart
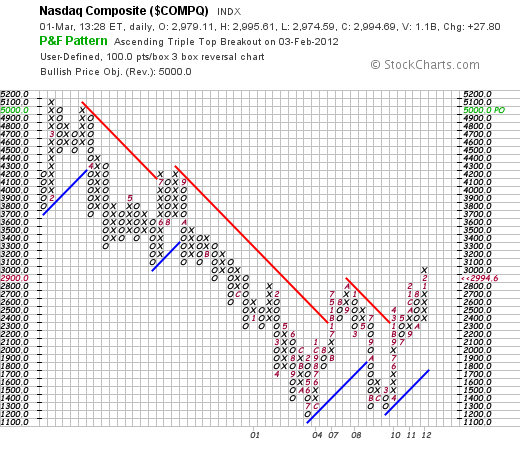
The Point & Figure chart below shows the Nasdaq forming two lows in the 1200 area and then breaking above its intermittent high this year. It looks like a massive Double Bottom with an upside price target around 5000. Each box equals 100 points to insure a long-term chart going back to 2000, which was the last time the Naz saw 5000.

Click this image for a live chart.


