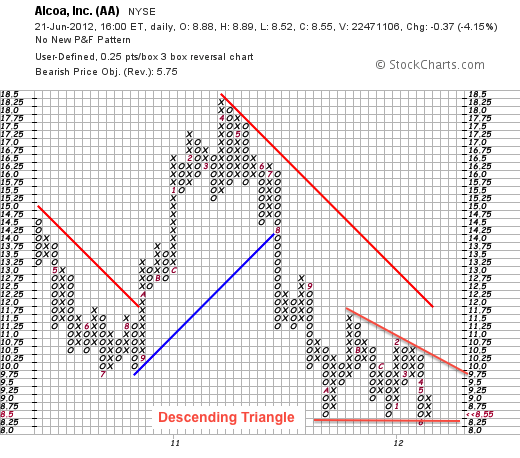
Alcoa Traces out Descending Triangle on Point & Figure Chart
Alcoa (AA) is part of the Basic Materials SPDR (XLB) and in a clear downtrend. On the P&F chart (3 x .25), the stock broke to new lows in 2011 and then formed a descending triangle the last nine months. The red A marks October 2011 and the red 6 marks June 2012. Even though the stock recovered from a support break this month, the trend remains down and further weakness is expected.

Click this image for a live version.


