Bearish Engulfings and Dark Clouds Litter the Pre-defined Scan Page
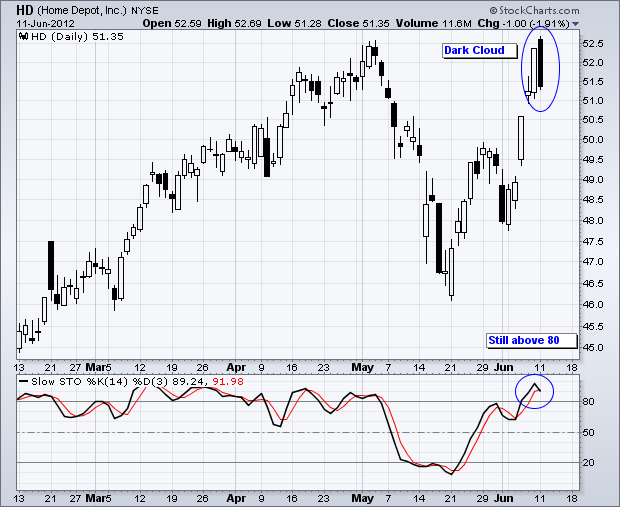
With a strong open and weak close on Monday, hundreds of stocks and ETFs formed either dark cloud patterns or bearish engulfing patterns. The chart below shows Home Depot (HD) forming a dark cloud near resistance and with the Stochastic Oscillator overbought. A move below 80 in the Stochastic Oscillator would signal a downturn in momentum. You can read more about candlestick patterns in the ChartSchool or see more scan results on the predefined scan page.

Click this image for a live version.


