StockCharts Logo StockCharts Icon
  • Log In
  • Free Trial
  • Welcome
    •   Your Dashboard
    •   Your ChartLists
    •   Your Scans
    •   Your Alerts
    •   Notifications
    •   Add-Ons and Upgrades
    •   Your Account
    •   Support Center
    •   Ask a Question
    •   Contact Us
    •   Log Out
  • SharpChart
  • ACP
  • Point & Figure
  • Symbol Summary
  • GalleryView
  • Interactive PerfChart
  • CandleGlance
  • Seasonality
  • RRG
  • Symbol Lookup
  • Charts & Tools

     Core Tools

    •   SharpCharts
    •   ACP
    •   Point & Figure
    •   Symbol Summary

     More Charting Tools

    •   GalleryView
    •   Seasonality
    •   CandleGlance
    •   MarketCarpets
    •   Interactive PerfCharts
    •   RRG Charts
    •   Dynamic Yield Curve

     Options Tools

    •   Options
    •   OptionsPlay Strategy Center

     Members Only

    •   Add-Ons
    •   Plug-Ins
    •   ChartPacks

     Charts to Watch

    •   Sample Chart Gallery NEW
    •   Historical Chart Gallery
    •   DecisionPoint Chart Gallery
    •   Public ChartLists
    All Tools 
  • Scans & Alerts

     Scanning Tools

    •   Advanced Scan Workbench
    •   Scheduled Scans
    •   Sample Scan Library NEW
    •   Predefined Scans

     Alert Tools

    •   Your Alerts
    •   Price Alert Workbench
    •   Advanced Alert Workbench
    •   Predefined Technical Alerts
  • Market Analysis

     Research Tools

    •   Market Summary NEW
    •   Sector Drill-Down
    •   US Industries
    •   Index Members
    •   SCTR Reports
    •   Earnings Calendar
    •   IPO Listings
    •   Cryptocurrencies

     Data, Reports & More

    •   Historical Price Data
    •   User-Defined Indexes
    •   Data Adjustments
    •   Sector PerfChart
  • Articles & Videos

     Articles

    •   Latest Articles
    •   ChartWatchers Newsletter

     Videos

    •   StockCharts TV on YouTube

     Authors

    • Arthur HillArthur Hill
    • Bruce FraserBruce Fraser
    • Carl SwenlinCarl Swenlin
    • Chip AndersonChip Anderson
    • David KellerDavid Keller
    • Frank CappelleriFrank Cappelleri
    • Gatis RozeGatis Roze
    • Grayson RozeGrayson Roze
    • Jay WoodsJay Woods
    • Jayanthi GopalakrishnanJayanthi Gopalakrishnan
    • Joe RabilJoe Rabil
    • John MurphyJohn Murphy
    • Julius de KempenaerJulius de Kempenaer
    • Karl MontevirgenKarl Montevirgen
    • Larry WilliamsLarry Williams
    • Martin PringMartin Pring
    • Mary Ellen McGonagleMary Ellen McGonagle
    • Milan VaishnavMilan Vaishnav
    • Tom BowleyTom Bowley
    • Tony ZhangTony Zhang
  • Your Dashboard
  • ChartSchool

     Table of Contents

    • All ChartSchool Articles
    • What Is Technical Analysis?
    • About Chart Analysis
    • Technical Indicators
    • Market Indicators

     Helpful Resources

    • Glossary
    • Index Catalog

     Timeless Wisdom

    • Gatis Roze: The Traders Journal
    • Greg Morris: Dancing With The Trend
  • Help

     Helpful Resources

    •   Support Center
    •   Ask a Question
    •   Report a Problem
    •   Site Map
    •   System Status

     Useful Info

    •   FAQs
    •   "What's New"
    •   "Getting Started" Series

     Symbols on StockCharts

    •   Symbol Catalog
    •   Request a Symbol

Our Largest Ever S&P 500 Chart!

August 20, 2012 at 10:47 PM
Chip Anderson
by Chip Anderson,

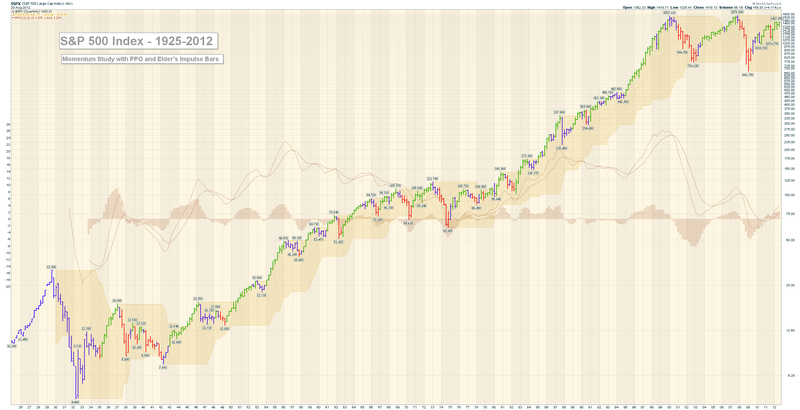
Let's do this again shall we?  To compliment our popular huge Dow Industrials chart, here's a similar one for the S&P 500 going all the way back to 1925.  Enjoy!
Spx1925

(Again, you may need to click on it once or twice to see it full-sized.)

- Chip

Chip Anderson
About The Author:

 Previous Article Next Article 

Read More

MEMBERS ONLY

The Best Five Sectors, #28

The Best Five Sectors, #28

Julius de Kempenaer
by Julius de Kempenaer,
Senior Technical Analyst, StockCharts.com

KEY TAKEAWAYS * No changes in sector ranking composition this week, a rare occurrence * Technology sector continues to dominate, showing sustained strength * Industrials rotating out of leading quadrant but maintaining second-highest RS ratio * Financials and materials showing negative trends, potentially exiting top 5 Sector Rotation Stalls, Tech Remains King Despite a...   READ MORE 

MEMBERS ONLY

Week Ahead: NIFTY Violates Short-Term Supports; Still Tentatively Devoid of Any Major Triggers

Week Ahead: NIFTY Violates Short-Term Supports; Still Tentatively Devoid of Any Major Triggers

Milan Vaishnav
by Milan Vaishnav,
Founder and Technical Analyst, EquityResearch.asia and ChartWizard.ae

The Nifty traded in a broadly sideways and range-bound manner throughout the week, ending it with a modest decline. The Index oscillated within a narrow 276-point range, between 25144.60 on the higher end and 24918.65 on the lower end, before settling mildly lower. The India VIX declined by...   READ MORE 

MEMBERS ONLY

The Real Drivers of This Market: AI, Semis & Robotics

The Real Drivers of This Market: AI, Semis & Robotics

Mary Ellen McGonagle
by Mary Ellen McGonagle,
President, MEM Investment Research

In this video, Mary Ellen spotlights the areas driving market momentum following Taiwan Semiconductor's record-breaking earnings report. She analyzes continued strength in semiconductors, utilities, industrials, and AI-driven sectors, plus highlights new leadership in robotics and innovation-focused ETFs like ARK. From there, Mary Ellen breaks down weakness in health...   READ MORE 

Featured Articles

MEMBERS ONLY

Three Bearish Candle Patterns Every Investor Should Know

Three Bearish Candle Patterns Every Investor Should Know

David Keller
by David Keller,
President and Chief Strategist, Sierra Alpha Research

KEY TAKEAWAYS * The shooting star pattern indicates a short-term rotation from accumulation to distribution. * The bearish engulfing pattern suggests sellers have taken control, suggesting further weakness. * The evening star pattern is a three-candle formation that illustrates an exhaustion of buying power. There is no denying that the broad markets remain...   READ MORE 

MEMBERS ONLY

RGTI Stock Surged 30% — Is This the Start of a Quantum Comeback?

RGTI Stock Surged 30% — Is This the Start of a Quantum Comeback?

Jayanthi Gopalakrishnan
by Jayanthi Gopalakrishnan,
Director of Site Content, StockCharts.com

KEY TAKEAWAYS * RGTI stock jumped 30% breaking out of a months-long sideways trading range. * RGTI bounced off its 50-day simple moving average and broke a downward-sloping trendline. * Alongside RGTI, other quantum computing stocks such as IONQ and QBTS also rallied fueled by optimism around the sector's progress. One...   READ MORE 

MEMBERS ONLY

Simpler Charts, Better Results? Use This Trick to Trade Smarter With Less

Simpler Charts, Better Results? Use This Trick to Trade Smarter With Less

Grayson Roze
by Grayson Roze,
Chief Strategist, StockCharts.com

Join Grayson as he shares how to streamline your analysis using custom ChartStyles. He demonstrates how to create one-click ChartStyles tailored to your favorite indicators, use style buttons to quickly switch between clean, focused views, and build a chart-leveling system that reduces noise and helps you stay locked in on...   READ MORE 

Experts


Arthur Hill Arthur Hill Bruce Fraser Bruce Fraser Carl Swenlin Carl Swenlin Chip Anderson Chip Anderson David Keller David Keller Frank Cappelleri Frank Cappelleri Gatis Roze Gatis Roze Grayson Roze Grayson Roze Jay Woods Jay Woods Jayanthi Gopalakrishnan Jayanthi Gopalakrishnan Joe Rabil Joe Rabil John Murphy John Murphy Julius de Kempenaer Julius de Kempenaer Karl Montevirgen Karl Montevirgen Larry Williams Larry Williams Martin Pring Martin Pring Mary Ellen McGonagle Mary Ellen McGonagle Milan Vaishnav Milan Vaishnav Tom Bowley Tom Bowley Tony Zhang Tony Zhang

Topics


Bonds Commodities Crypto Equities ETFs Forex Indicators Market Analysis Members Only Options Sectors Trading Strategies

Featured Articles


MEMBERS ONLY

Three Bearish Candle Patterns Every Investor Should Know

Three Bearish Candle Patterns Every Investor Should Know

David Keller
by David Keller,
President and Chief Strategist, Sierra Alpha Research

KEY TAKEAWAYS * The shooting star pattern indicates a short-term rotation from accumulation to distribution. * The bearish engulfing pattern suggests sellers have taken control, suggesting further weakness. * The evening star pattern is a three-candle formation that illustrates an exhaustion of buying power. There is no denying that the broad markets remain...   READ MORE 


MEMBERS ONLY

RGTI Stock Surged 30% — Is This the Start of a Quantum Comeback?

RGTI Stock Surged 30% — Is This the Start of a Quantum Comeback?

Jayanthi Gopalakrishnan
by Jayanthi Gopalakrishnan,
Director of Site Content, StockCharts.com

KEY TAKEAWAYS * RGTI stock jumped 30% breaking out of a months-long sideways trading range. * RGTI bounced off its 50-day simple moving average and broke a downward-sloping trendline. * Alongside RGTI, other quantum computing stocks such as IONQ and QBTS also rallied fueled by optimism around the sector's progress. One...   READ MORE 


MEMBERS ONLY

Simpler Charts, Better Results? Use This Trick to Trade Smarter With Less

Simpler Charts, Better Results? Use This Trick to Trade Smarter With Less

Grayson Roze
by Grayson Roze,
Chief Strategist, StockCharts.com

Join Grayson as he shares how to streamline your analysis using custom ChartStyles. He demonstrates how to create one-click ChartStyles tailored to your favorite indicators, use style buttons to quickly switch between clean, focused views, and build a chart-leveling system that reduces noise and helps you stay locked in on...   READ MORE 

Premium Content


MEMBERS ONLY

This Market Sector is Starting to Emerge as a Leader; Can it Complete the Job?

This Market Sector is Starting to Emerge as a Leader; Can it Complete the Job?

Martin Pring
by Martin Pring,
President, Pring Research

Many years ago, I developed a couple of indexes that were designed to give me a sense of whether industry groups benefiting from inflationary conditions were outperforming those who performed better under deflationary ones. It was my way of recognizing the fact that, in a broad sense, the business cycle...   READ MORE 


MEMBERS ONLY

This Tool Could Change Your Options Trading Forever

This Tool Could Change Your Options Trading Forever

Tony Zhang
by Tony Zhang,
Chief Strategist, OptionsPlay

Unlock the power of automated options trading with Tony Zhang, Chief Strategist at OptionsPlay. In this exclusive training, Tony reveals how the OptionsPlay Strategy Center, integrated with StockCharts.com, transforms the way traders find, analyze, and execute options strategies. Follow along as Tony illustrates how to use OptionsPlay and StockCharts...   READ MORE 


MEMBERS ONLY

Bitcoin Breaks to an All-Time High; Should We Uncork the Champagne?

Bitcoin Breaks to an All-Time High; Should We Uncork the Champagne?

Martin Pring
by Martin Pring,
President, Pring Research

Bitcoin broke out to a new all-time high last week, so it seemed to me that it would be a good time to come out with a bullish article. After all, Chart 1 shows that a solid breakout came from a one-year reverse head-and-shoulders pattern, which was also accompanied by...   READ MORE 

ChartWatchers The StockCharts Newsletter

Get expert technical commentary delivered straight to your inbox! Sign up for our FREE weekly ChartWatchers Newsletter. Learn More

Marketplace


Explore our full collection of exclusive plug-ins and premium add-ons, designed to instantly enhance your investing, trading and charting experience with powerful indicators, data, market insights and other technical capabilities.

 Add-Ons  Plug-Ins  ChartPacks
Explore More

Expert market commentary delivered right to your inbox, for free.

Sign up for our weekly ChartWatchers Newsletter

Learn More  

On StockCharts

  • Charts & Tools
  • Articles
  • StockCharts TV
  • ChartSchool

Members

  • Your Dashboard
  • Your ChartLists
  • Advanced Scans
  • Technical Alerts

Help

  • Support Center
  • FAQs
  • Contact Us
  • Symbol Catalog
  • Pricing

Company

  • About Us
  • What's New
  • Careers
StockCharts.com Logo
Download StockCharts On The App Store Download StockCharts On The App Store Download StockCharts On The Google Play Store Download StockCharts On The Google Play Store

© StockCharts.com, Inc. All Rights Reserved.

  • Terms of Service
  • Privacy Statement
  • Site Map

Market data provided by Xignite, Inc. Commodity and historical index data provided by Pinnacle Data Corporation. Cryptocurrency data provided by CryptoCompare. Unless otherwise indicated, all data is delayed by 15 minutes. The information provided by StockCharts.com, Inc. is not investment advice. Trading and investing in financial markets involves risk. You are responsible for your own investment decisions.