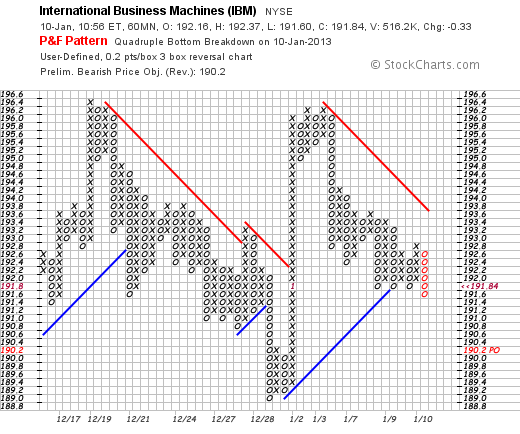
IBM Forges Quadruple Bottom Breakdown on P&F Chart
IBM has been underperforming the broader market for several months and continued this trend with a break below support. On the P&F chart, notice how the stock formed three O-Columns with equal lows in January. The current O-Columnm which is red, broke below these lows to forge the quadruple bottom breakdown and target a move to the 190 area. Note: this is a 60-minute P&F chart with 20 cent boxes.

Click this image for a live chart


