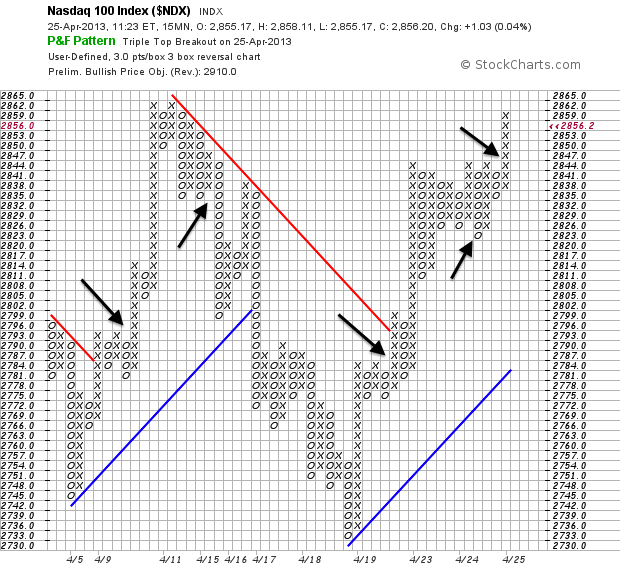
Nasdaq 100 Breaks Out on 15 minute P&F Chart
The Nasdaq 100 ($NDX) swings have been quite wild this month, but the 15 minute P&F chart captured these pretty well. In particular, the Triple Top Breakout and Triple Bottom Breakdown identified the early April upswing, the mid April downswing and the upswing over the past week. There was, however, a bad signal just before today's breakout. The black arrows point to these signals.

Click this image for a live chart


