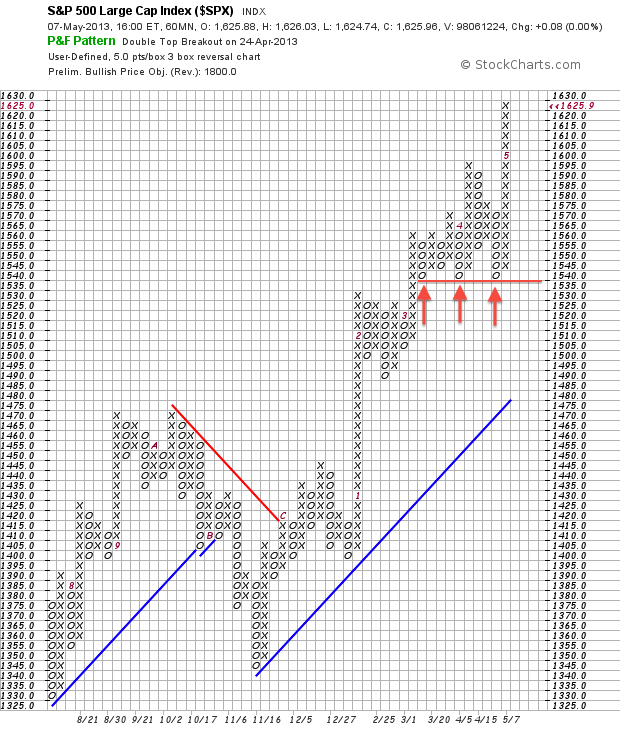
60-minute P&F Chart Shows Clear Support for S&P 500
Point & Figure charts filter out the noise and ignore time to give chartists a clean look at price action. On the 60-minute P&F chart below, the S&P 500 bounced off the 1540 level three times since mid March. This is about as clear of a support level as you will see and chartists should watch it going forward.

Click this image for a live chart.


