Dollar Tree Holds the Breakaway Gap
The Dollar Tree chart shows two breakaway gaps in opposite directions. The first breakaway gap occurred in November and started a downtrend. The second breakaway gap occurred in late May and held for over a week. Like the November gap, this gap occurred on high volume and could signal the start of a sustained advance. Last week's low marks first support at 52.
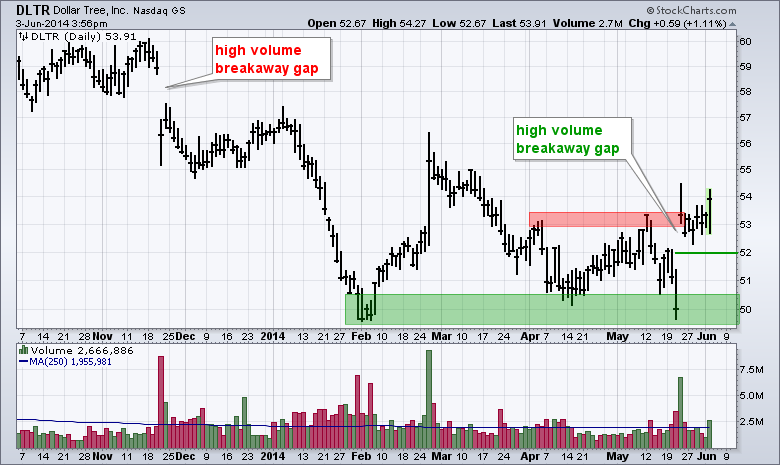
Click this image for a live Chart


