IWM Breaks Bearish Resistance Line on P&F Chart
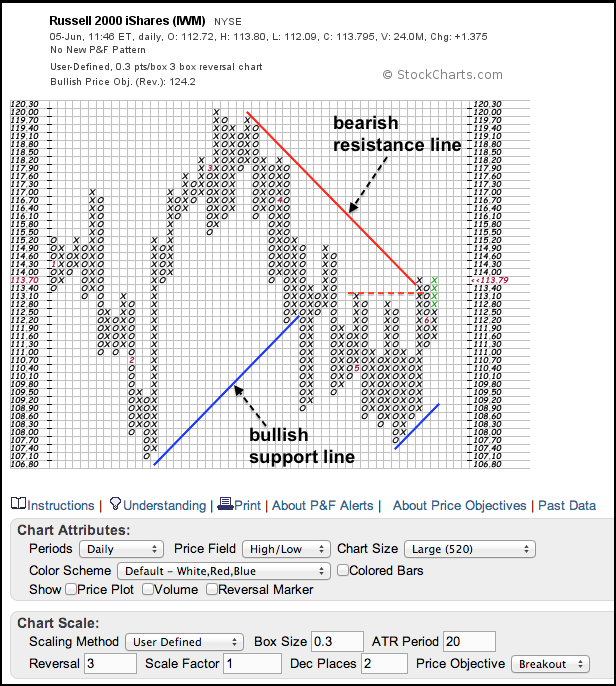
The P&F chart below shows the Russell 2000 ETF (IWM) with 30-cent boxes to capture the medium-term trend. Notice that this chart extends back to January, which is marked by the red numeral 1 in the first column. The ETF broke the bullish support line in April and then firmed in May. The surge above 113.4 broke the red bearish resistance line and this indicates that the trend is changing.
Click this image for a live Chart


