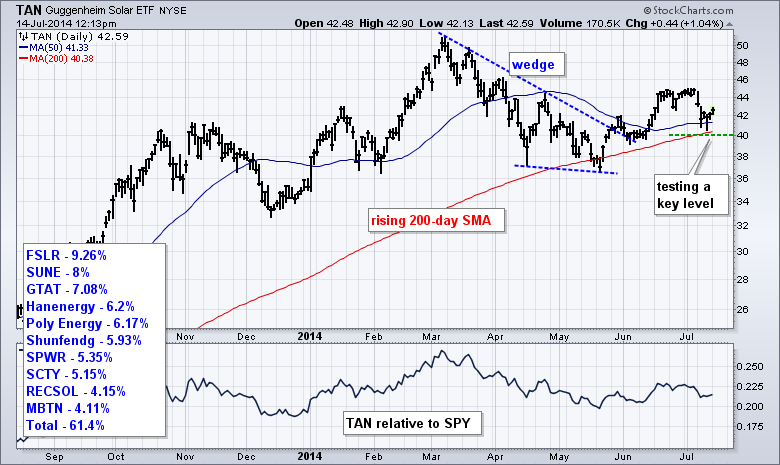
Solar Energy ETF Tests Key Moving Averages
After a wedge breakout in late May, the Solar Energy ETF (TAN) is testing this breakout and two key moving averages in July. Notice how the 50-day and 200-day moving averages converge in the 40-41 area. TAN is currently above both and the 50-day is above the 200-day. The bias is still positive, but a move below 40 would break both moving averages and turn the bias bearish.
Click this image for a live chart


