Breakouts Turn Support on S&P 500 P&F Chart
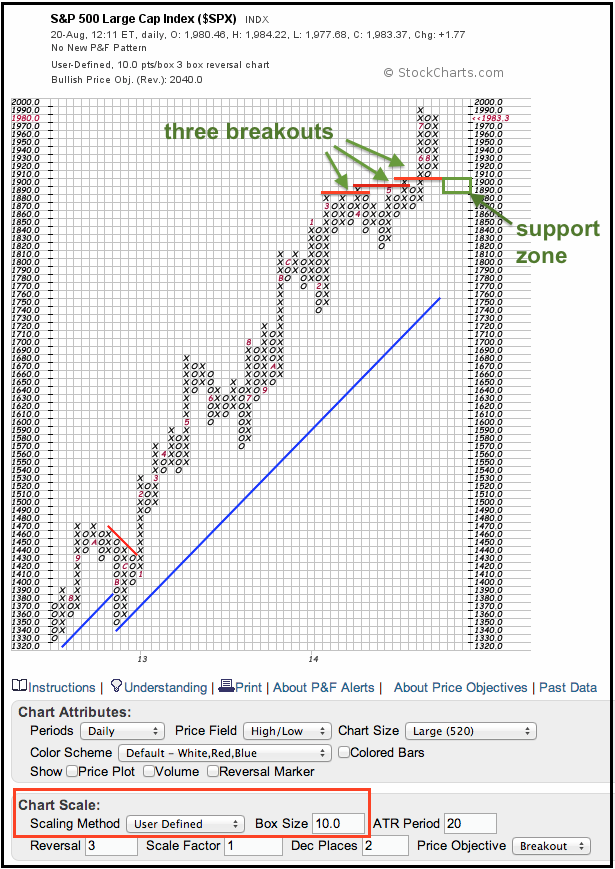
The Point & Figure chart below, which is based on 10 points per box, shows the S&P 500 with successive upside breakouts in April, May and June. A key tenet of technical analysis is that broken resistance turns into support. The green support box, therefore, is based on these three breakouts and marks a significant support zone in the 1880-1900 area. Notice that the S&P 500 held the top of this zone with the July-August decline (red 8).
Click this image for a live chart


