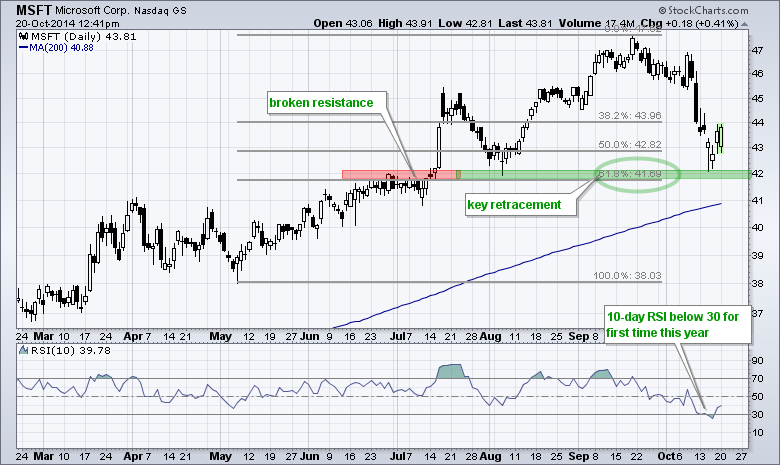
Microsoft Bounces off Key Retracement
The chart below shows Microsoft (MSFT) falling to broken resistance, firming for two days and bouncing over the last two days. Also notice that this bounce occurred at the 62% retracement. Even though the decline looks steep, support held where it should and the stock is above the rising 200-day moving average (long-term uptrend). The indicator window shows 10-period RSI becoming oversold for the first time this year and moving above 30 on Friday.
Click this image for a live chart.


