Schwab Goes for a Break as Volume Indicator Leads
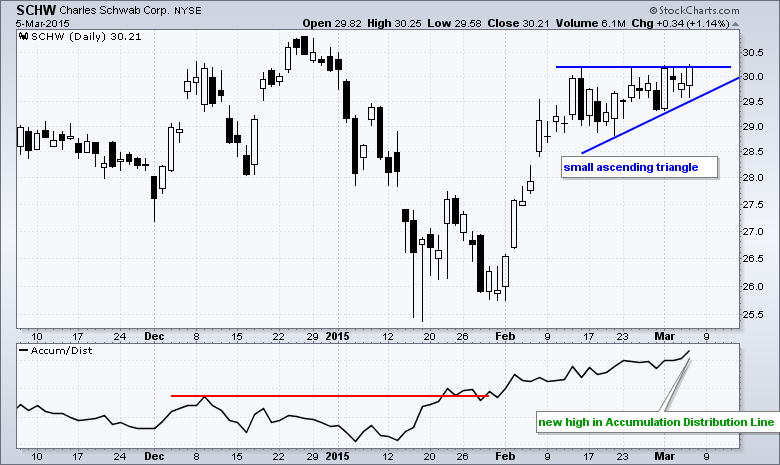
Charles Schwab (SCHW) surged in February and then consolidated the last few weeks with an ascending triangle, which is a bullish continuation pattern. A breakout would signal a continuation of the prior advance and target a move to new highs. The indicator window shows the Accumulation Distribution Line (ACDL) hitting a new high already, and this indicates that stock has been under accumulation during this ascending triangle.
Click this image for a live chart


