Apple Shows Positive Divergence on 60 Minute Chart
Apple (AAPL) is breaking down beneath its November low and on the surface appears to be a broken stock, but its intraday 60 minute chart is telling a much different story. Given the slowing volume this afternoon and near test of Wednesday's pre-Fed low, AAPL's turn higher in its hourly MACD has me hopeful that it's close to a short-term bottom. Perhaps it's already been reached. In addition to the slowing selling momentum, AAPL's RSI is close to 30 and that oversold indication has proven to be a solid entry point in the past few months as highlighted by the black shaded circles below:
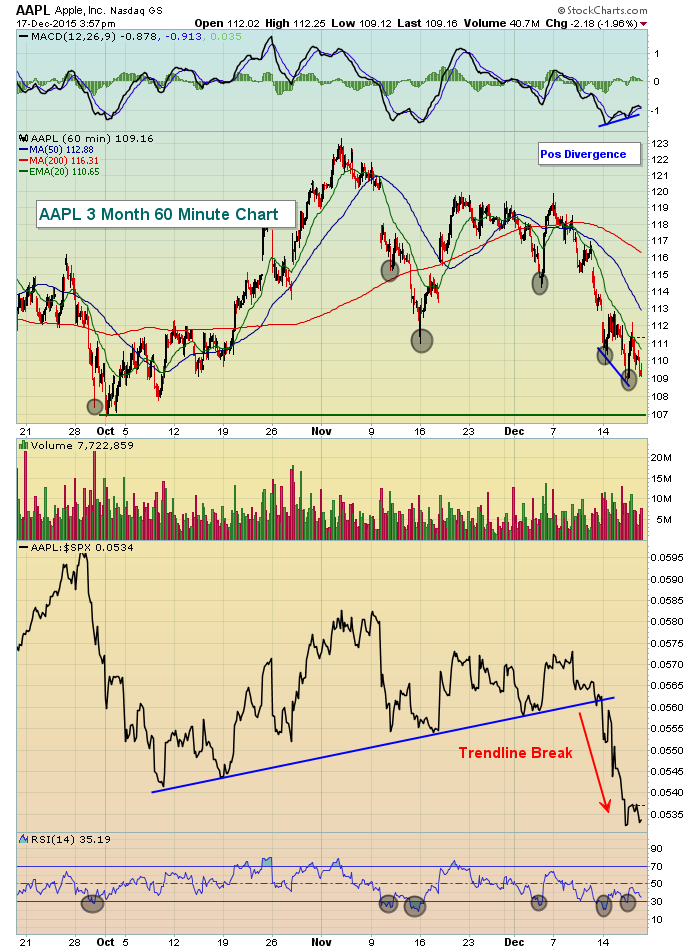
Relative to the S&P 500, AAPL has clearly been laggard, but the combination of oversold RSI, a positive divergence and the more favorable seasonal period from December 16 through December 31 could be enough to turn the tide here.
Happy trading!
Tom


