Here's How To Use The MACD For A Sell Signal
My favorite indicator, other than the combination of price and volume, is definitely the MACD. I've studied it for years and I use it as a very important momentum indicator in my trading strategy. It's mostly a lagging indicator as it uses prior closing prices to determine the difference between two moving averages. But it also provides us a predictive benefit as price momentum begins to slow before we actually see prices deteriorate. As an example, let's look at the chart of Oclaro (OCLR):
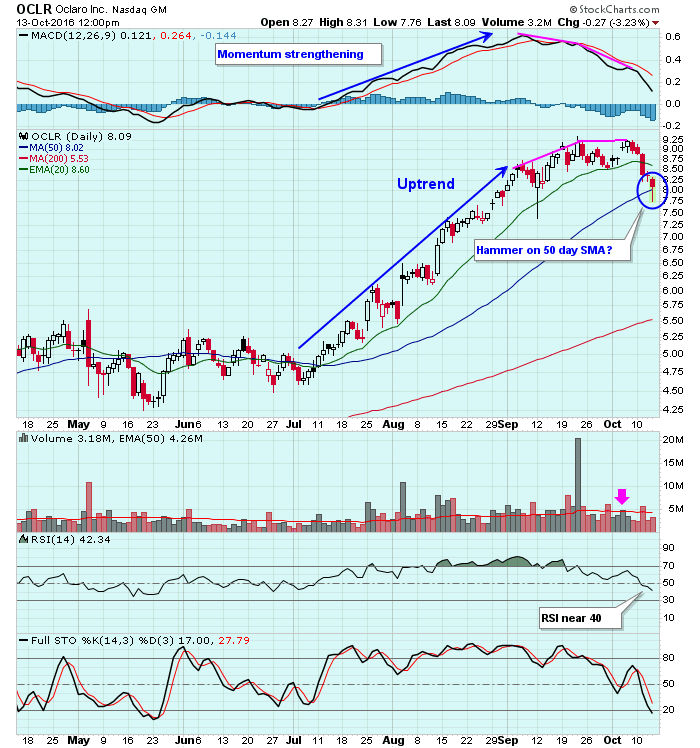
For two months, prices rose and were accompanied by higher MACD readings. That's a signal that momentum is strengthening because the short-term moving average is rising faster than the long-term moving average. Pullbacks during such advances tend to be shallow and the rising 20 day EMA typically is problematic for sellers of the stock. But after a negative divergence emerges, you have to begin looking for an exit point, especially if you're a short-term trader. In mid-September, OCLR printed a negative divergence but on that breakout, volume exploded higher. It's difficult to argue a stock is losing momentum when heavy volume accompanies a breakout. This is very important - remember that the MACD considers price only, not volume. So a better sign to me with regard to slowing momentum is when the negative divergence occurs with light to moderate volume - as it did earlier this month. Volume was average on the last breakout. You don't want to be buying stocks breaking out on average volume with a negative divergence in play. Instead, show patience and discipline and allow stocks to "reset" their MACDs at or near centerline support. If OCLR prints a hammer today on its 50 day SMA, we could see this become a very tradable bottom in the near-term. At a minimum, it's certainly a much better reward to risk trade now than where it was with the negative divergence emerging.
Happy trading!
Tom


