Hasbro Hits Stiff Resistance Zone

I do not often highlight stocks with bearish setups during a bull market, but Hasbro shows some serious weakness over the past year and looks poised to peak again.
First and foremost, the chart shows Hasbro (HAS) hitting a 52-week low in early April and this means the long-term trend is down. Also notice that the 50-day EMA is below the 200-day EMA and price is below the falling 200-day EMA.
Hasbro recently broke a support zone in March and bounced back to this zone in April-May. A basic tenet of technical analysis is that broken support turns into resistance. Also notice that the bounce retraced 50% of the prior decline, which is normal for a counter-trend rally. The combination of resistance and retracement suggests that the stock could reverse in this area.
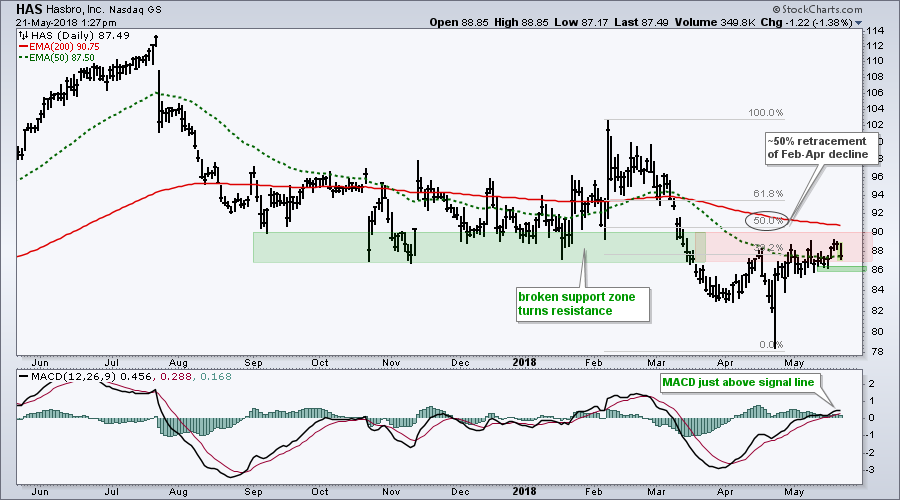
I would expect Hasbro to reverse in the 88 area and will watch two items for a signal. First, a break below the mid May low at 86 would signal a short-term downturn in price. Second, a signal line crossover in MACD would signal a downturn in momentum.
On Trend with Arthur Hill
On Trend is my show on StockCharts TV and it can been every Tuesday at 10:30 AM. The show repeats immediately afterwards at 11 AM ET and again throughout the week. There is also a video archive on Youtube. StockChartsTV and the video archives are available to everyone.
Plan Your Trade and Trade Your Plan.
- Arthur Hill, CMT
Senior Technical Analyst, StockCharts.com
Book: Define the Trend and Trade the Trend
Twitter: Follow @ArthurHill


