Autozone Gets Back in Gear

Autozone (AZO) is a leading stock because it recorded a 52-week high in December and remains above the rising 200-day SMA. The S&P 500, on the other hand, recorded a 52-week low in December and remains below its 200-day SMA.
The chart below shows AZO with a falling wedge correction over the last six weeks. Even though this correction occurred when the S&P 500 moved higher, I still view it as a pullback within a bigger uptrend. The falling wedge is typical for a pullback within a bigger uptrend and the decline retraced around 50% of the prior advance. Think two steps forward and one step backward. Also notice that AZO is finding support near the prior breakout zone (780-800). As such, I would expect an upside breakout and continuation at some point.
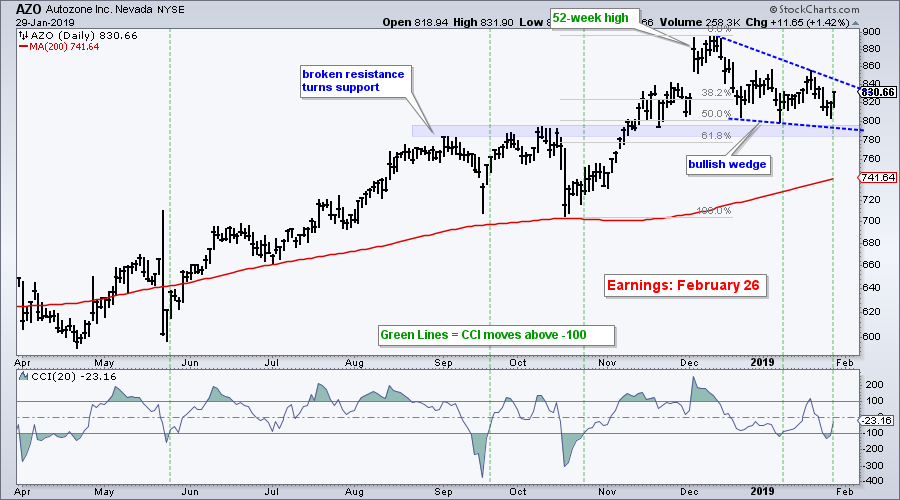
The indicator window shows the Commodity Channel Index (CCI), which is a momentum oscillator. A move below -100 points to oversold conditions and a move below -200 points to serious oversold conditions. CCI dipped below -100 twice this year and moved back above with Tuesday's bounce. The green lines show when CCI turned up in the past.
On Trend on YouTube
Monitoring Precarious Cross Currents
- Short-term Breadth Indicators Holding Up
- A Battle Royal Between Two SMAs
- Going Nowhere with 4 Gaps in 6 Days
- Key Supports for Sector and Industry ETFs
- Bonds, Dollar, Gold and Oil
- Click here to Watch
- Arthur Hill, CMT
Senior Technical Analyst, StockCharts.com
Book: Define the Trend and Trade the Trend
Twitter: Follow @ArthurHill


