Palo Alto Networks Breaks from the Pack

Most stocks have struggled since November, but Palo Alto Networks managed to reverse at a key area and break above a resistance zone.
The chart below shows PANW with weekly bars over the last 3 years. The stock broke to new highs in February 2018 and more than doubled from spring 2017 to autumn 2018. Notice how the stock recorded numerous 52-week highs from January to August 2018. Stocks recording 52-week highs are leading the market and attracting attention. The gray lines show the 52-week price channel to mark the 52-week high-low range.
The blue zone marks a reversal area using broken resistance and the Fibonacci Retracements Tool. Even though the stock fell hard from October to December, it did not record a 52-week low and found support near broken resistance (blue zone). Also notice that the decline retraced 50-61.8% of the prior advance. This is a classic setup that chartists should keep in mind for future reference (return to breakout and 50-61.8% retracement).
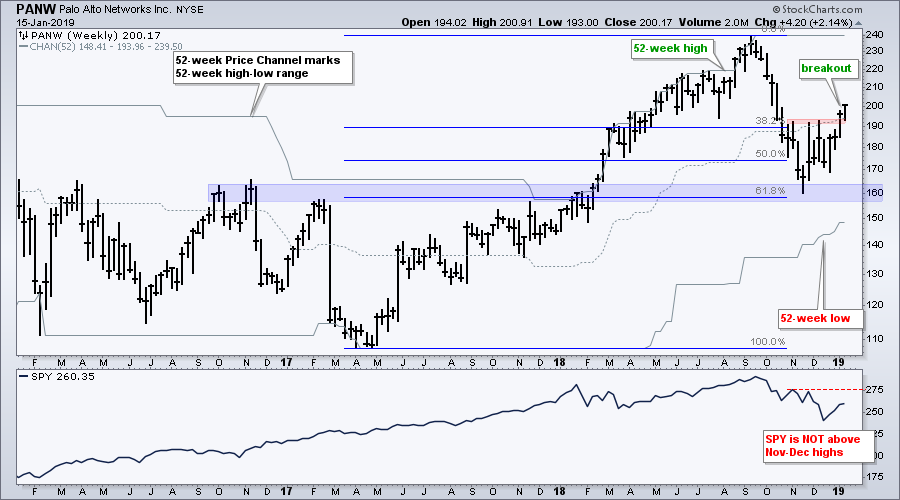
PANW is showing leadership here in 2019 as it breaks above its November-December highs. In contrast, the lower window shows SPY trading well below these highs. The price breakout shows absolute strength and the comparison with SPY shows relative strength. Despite a questionable environment for the broader market, this is a powerful combination that could foreshadow new highs in the coming months.
On Trend on YouTube
Separating the Signal from the Noise
- Big Breakdown vs Zweig Thrust vs Resistance
- Overbought Indicators and Waning Breadth
- Watching the Windups (XLK, XLV, XLC, GLD)
- Pullback for Treasuries and Surge in Junk
- Comparing the Bounce using Stochastics
- Stocks to Watch (KR, RMD, SBUX, TWLO)
- Click here to Watch
- Arthur Hill, CMT
Senior Technical Analyst, StockCharts.com
Book: Define the Trend and Trade the Trend
Twitter: Follow @ArthurHill


