VerSign Holds One Key Moving Average and Retakes Another

The broad market environment remains rather negative overall with the S&P 500 well below its falling 200-day SMA and volatility increasing over the last few months. Note that the different environments were highlighted in ChartWatchers this weekend. After a sharp decline into Christmas, stocks rebounded over the last two weeks and this rebound remains in play. As such, I will focus on a bullish setup today. Also note that earnings season starts soon.
VeriSign (VRSN) surged to a 52-week high with a big gap in early November and then corrected over the last two months. The long-term trend is still up because the stock largely held the rising 200-day SMA and the 50-day SMA remains above the 200-day SMA.
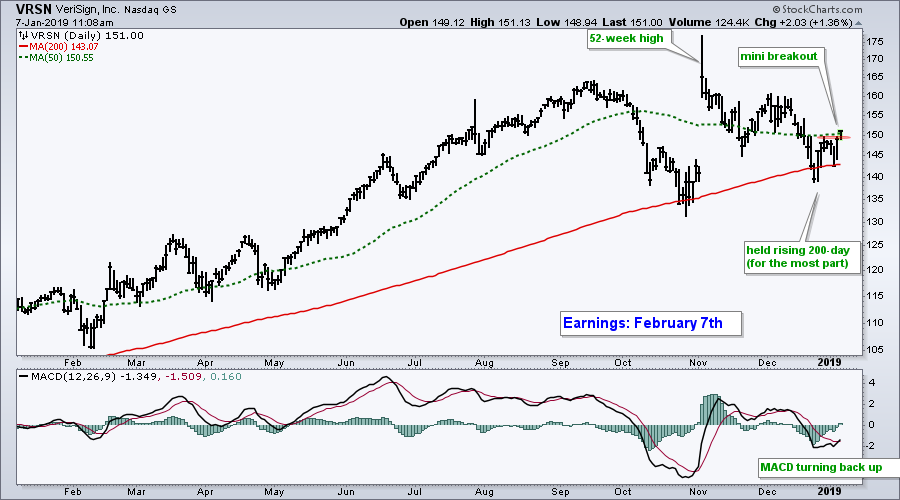
There are signs that the correction could be ending as the stock turns up and breaks its 50-day SMA. The indicator window confirms this upturn as MACD moved above its signal line with an move higher this year.
On Trend on Youtube
On Trend: Assessing the Current Market Environment.
- 5-day RoC Goes Nuts
- Rubber Band Bounces and Consolidations
- Forget Relative and Focus on Absolute
- Treasuries versus Junk and Global Yields
- Uptrends Outside the U.S.
- FAANG plus Four
- Click here to Watch
- Arthur Hill, CMT
Senior Technical Analyst, StockCharts.com
Book: Define the Trend and Trade the Trend
Twitter: Follow @ArthurHill


