Here Is Another Sector Breaking To New Highs!
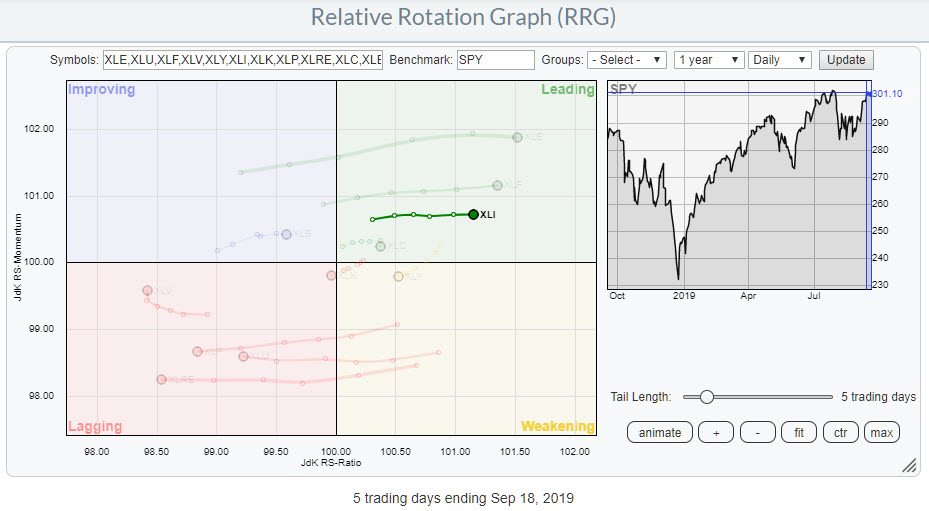
Today, I posted a Relative Rotation Graph for US sectors on my Twitter and Instagram feeds highlighting the clear split between some sectors now visible on the daily timeframe. One of these sectors is Industrials, which is traveling deeper into the leading quadrant at a stable, almost horizontal, relative momentum.
Here is the RRG that I posted. You can see the split between Industrials, Financials and Energy on one side (leading) and Real Estate, Staples and Utilities on the other side (lagging)
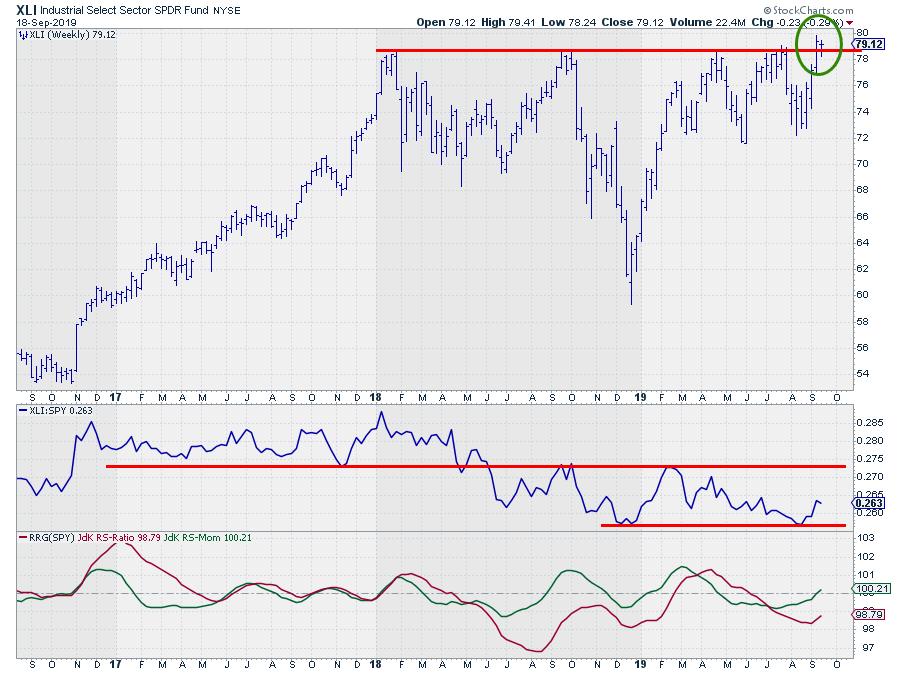
Zooming in on the chart for Industrials (top chart), it can be seen that this sector is trying hard to remain above the former resistance level (around $78.65), which it broke last week.
Last Friday, XLI closed at $79.35, and this week the sector is trying to hold up. The break is not super-convincing yet, but things are looking good. If we can hold up above the level of these former highs, the market is sending us a message that supply is drying up there and that any new impulse could trigger an acceleration and further rise for this sector.
From a relative point of view, the RS-Line has bounced off a horizontal support level and could now go for a test of the upper boundary of the range, which is visible in that chart (middle pane).
The RRG-Lines are picking up on this improvement, with Jdk RS-Momentum crawling above 100 on the weekly scale and the JdK RS-ratio starting to curl upward. This positions XLI inside the improving quadrant on the weekly RRG at a mildly positive RRG-Heading, and it has just turned into the 0-90 degree angle.
I am certainly going to watch the development and the relationship between the current strength on the daily RRG and the emerging strength on the weekly plot. The break to new highs in price is likely to impact the relative move in a positive way.
-Julius
My regular blog is the RRG Charts blog. If you would like to receive a notification when a new article is published there, simply "Subscribe" with your email address.
Julius de Kempenaer
Senior Technical Analyst, StockCharts.com
Creator, Relative Rotation Graphs
Founder, RRG Research
Want to stay up to date with the latest market insights from Julius?
– Follow @RRGResearchon Twitter
– Like RRG Researchon Facebook
– Follow RRG Researchon LinkedIn
– Subscribe to the RRG Chartsblog on StockCharts
Feedback, comments or questions are welcome at Juliusdk@stockcharts.com. I cannot promise to respond to each and every message, but I will certainly read them and, where reasonably possible, use the feedback and comments or answer questions.
To discuss RRG with me on S.C.A.N., tag me using the handleJulius_RRG.
RRG, Relative Rotation Graphs, JdK RS-Ratio, and JdK RS-Momentum are registered trademarks of RRG Research.


