PNC Signals Strength As Its Tail Rotates Back Into The Leading Quadrant on RRG
The Financial sector (XLF) continues to pick up relative strength. On the weekly RRG, XLF just moved into the improving quadrant and is positioned very close to the center of the chart. On the daily RRG, a very nice and strong rotation can be seen over the last three weeks. Starting inside the weakening quadrant, XLF rotated through lagging, then spent two days inside improving and has now pushed into the leading quadrant.
This makes Financials a sector to keep an eye on in coming weeks.
Inside the sector, you can see some strong rotations are visible. I wrote about the strength of JPM about a month ago in a ChartWatchers article; that stock is still leading the sector higher.
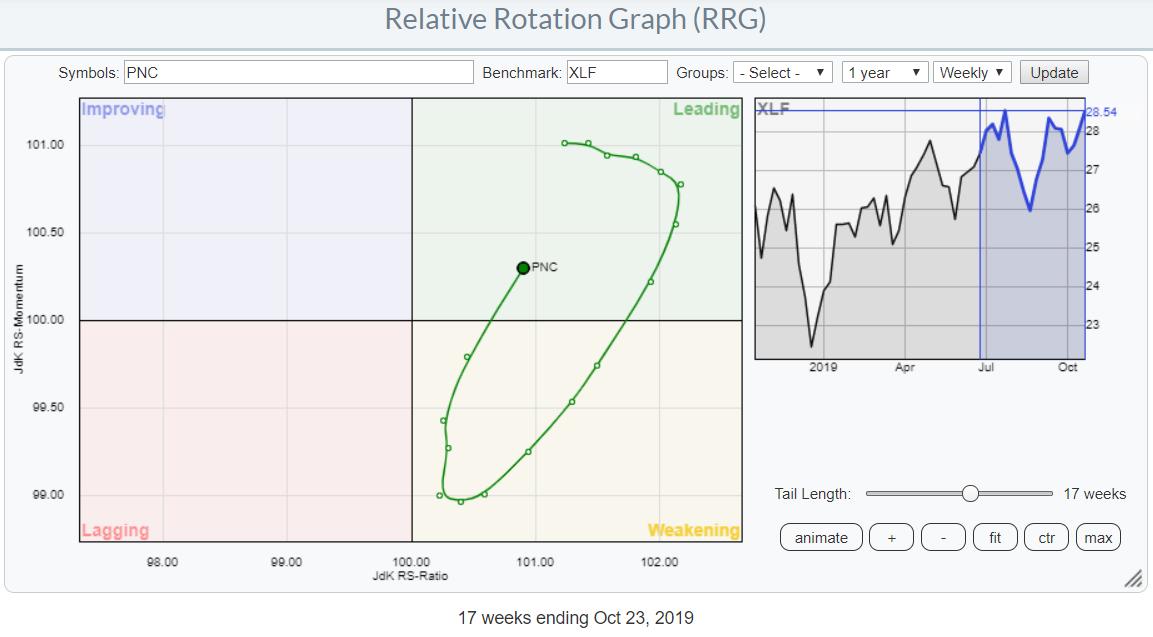
For this article, I want to take a look at PNC.
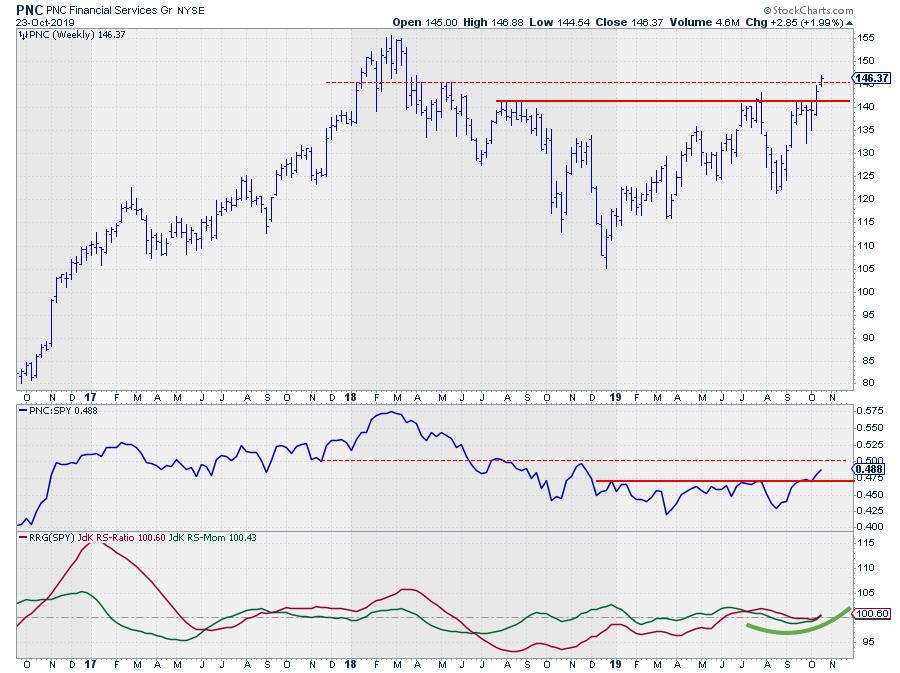
After an initial rotation from improving to leading, PNC rolled over and rotated into weakening. Now, the tail rotated from weakening into leading without hitting the lagging quadrant, which is generally a strong sign as it indicates the second (or third, etc.) leg of a relative uptrend. On the price chart, in combination with relative strength and RRG-Lines, this appears as the red RS-Ratio line bottoming out just above the 100 line and starting to rise again together with the RS-Momentum line.
The break above horizontal resistance in the RS-Line will likely act as a catalyst for more relative upside in the coming weeks. Taking out the light dashed overhead resistance will only add to the current strength.
On the price chart, overhead resistance is already broken; the next stop for the price will very likely be in the $155 area, where a major high was set in the beginning of 2018.
All in all, PNC is a stock to watch for more upside potential. Risk is being limited by old resistance levels that will start to act as support going forward.
-Julius
My regular blog is the RRG Charts blog. If you would like to receive a notification when a new article is published there, simply "Subscribe" with your email address.
Julius de Kempenaer
Senior Technical Analyst, StockCharts.com
Creator, Relative Rotation Graphs
Founder, RRG Research
Want to stay up to date with the latest market insights from Julius?
– Follow @RRGResearchon Twitter
– Like RRG Researchon Facebook
– Follow RRG Researchon LinkedIn
– Subscribe to the RRG Chartsblog on StockCharts
Feedback, comments or questions are welcome at Juliusdk@stockcharts.com. I cannot promise to respond to each and every message, but I will certainly read them and, where reasonably possible, use the feedback and comments or answer questions.
To discuss RRG with me on S.C.A.N., tag me using the handleJulius_RRG.
RRG, Relative Rotation Graphs, JdK RS-Ratio, and JdK RS-Momentum are registered trademarks of RRG Research.


