Europe is Ready to Turn Around a Long Period of Underperformance

From time to time, I keep an eye on the Relative Rotation Graph showing the rotations of various world markets against the DJ Global Index. The tail on Europe ($E1DOW) has just crossed into the leading quadrant after a quick improving-lagging-improving rotation, setting it up for a powerful rotation into the leading quadrant.
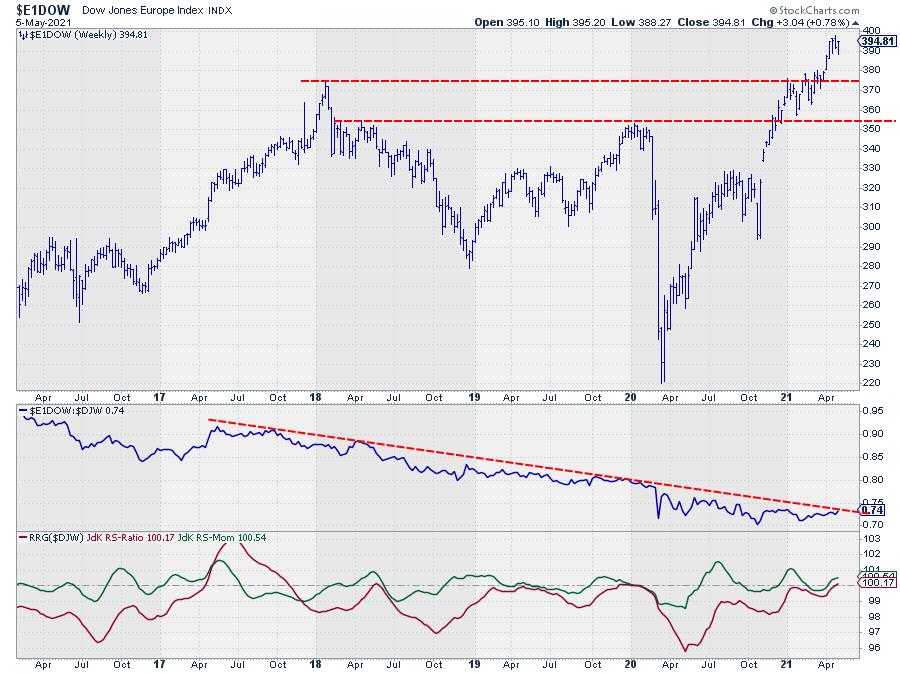
The chart of $E1DOW above shows two important breakouts that occurred at the start of 2020 and again at the start of 2021. These are important preludes to a further strengthening of this market.
The relative strength line of Europe vs. the World is showing a long decline that is capped by a falling resistance line connecting the major highs. The bottoming process in the RS-Line still needs a bit more time to fully complete, but the improvement is clearly visible.
This is certainly the case when we look at the RRG-Lines below the RS-Line. The gradual improvement of the relative strength of $E1DOW vs $DJW is already visible since April 2020, which has recently resulted in a crossover into the leading quadrant.
But a more interesting break lies around the corner.
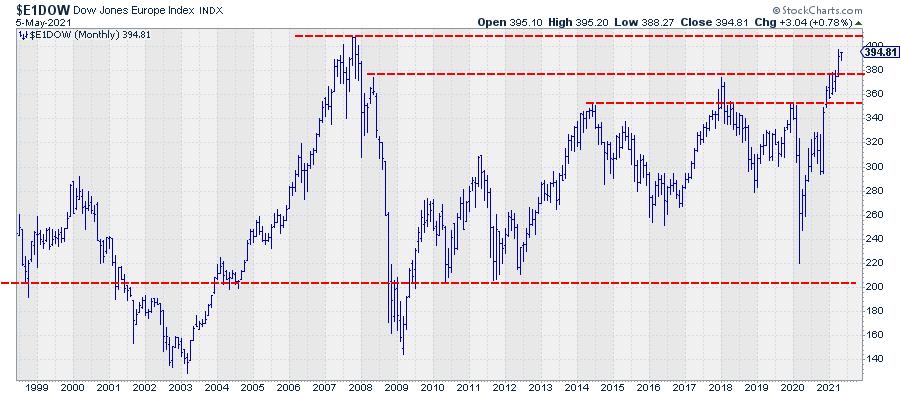
On the monthly chart of $E1DOW, the all-time high that was formed back in 2007 becomes visible. Breaking beyond that level will put European markets at the start of a new long-term move higher for the first time in more than almost 15 years. Once that happens, it will, very likely, cause a major shift in relative strength for European markets vs. the rest of the world as well.
#StaySafe, --Julius
My regular blog is the RRG Charts blog. If you would like to receive a notification when a new article is published there, simply "Subscribe" with your email address.


