Week Ahead: Nifty Tests Key Support Levels—May Weaken If Levels Violated

The markets traded with a negative bias throughout the past week, as Nifty faced consistent selling pressure at higher levels and closed the week on a weaker note. After opening on a subdued note, the Index marked an intra-week high at 24,956.50 and a low at 24,535.05, oscillating in a narrow 421-point range. Volatility increased as India VIX rose by 6.21% to 11.98. Ultimately, Nifty closed the week with a net loss of 271.65 points or 1.09%. The markets have ended on a negative note for the fifth consecutive week.
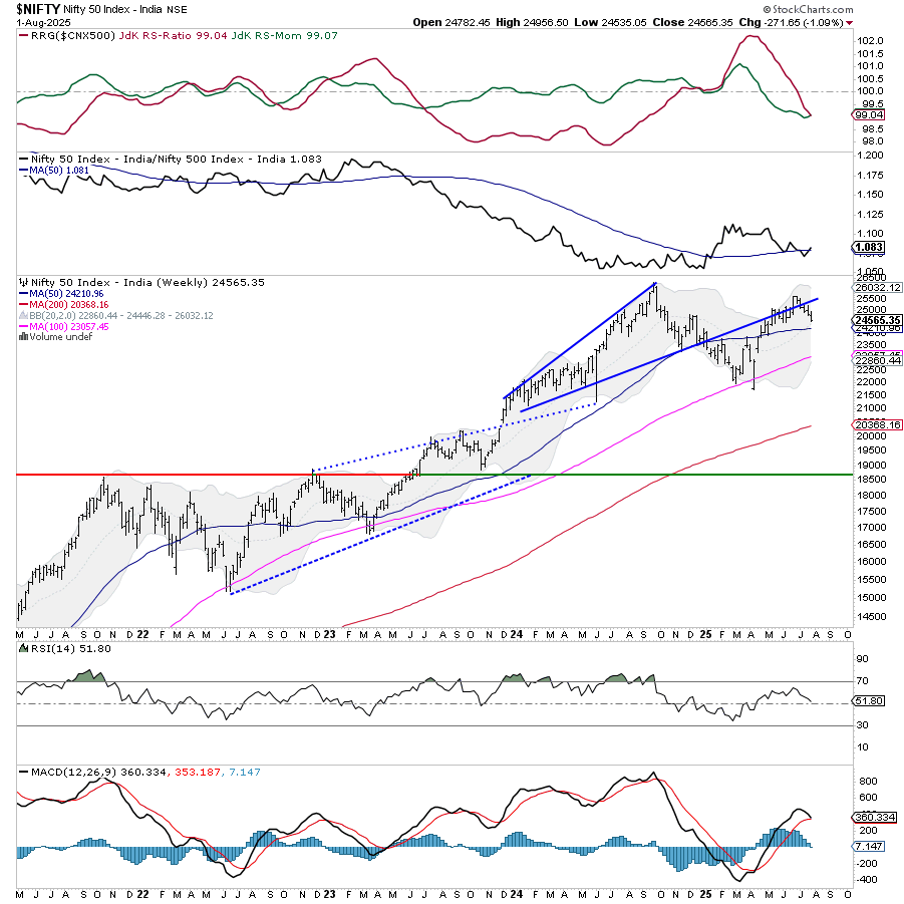
The current technical structure shows that the Nifty has continued to face overhead resistance from the upper Bollinger BandⓇ while slipping below its short-term 20-day moving average. The Index appears to be undergoing a minor corrective phase after a sustained rally. It has breached a short-term rising trendline support on the weekly timeframe while retesting the crucial support of 24500 on the daily timeframe. While the primary trend remains intact, the Index now trades below the 20-day MA and appears to be attempting a mean reversion. 24,212, represented by a 50-week MA followed by 24000, may emerge as an immediate support area, and a violation of this range may accelerate the correction. On the upside, a breakout above 24,950–25,000 will be essential to resume the uptrend.
The coming week is likely to see a cautious and tentative start. Resistance levels are placed at 24,800 and 25,000; supports come in at 24,200 and 24,000.
The weekly RSI stands at 51.79 and is still neutral while forming a fresh 14-period low, showing no divergence against the price. The MACD remains above the signal line, maintaining a bullish crossover, but the histogram shows contraction, indicating waning momentum. The weekly candle is a small bearish bar with a slightly long upper shadow, suggesting selling at higher levels.
Pattern analysis of the weekly chart reveals a breakdown below a short-term ascending trendline support, indicating the beginning of a likely consolidation or minor retracement. The Index continues to stay above the 50-week moving average, which currently lies at 24,212. This keeps the broader trend intact, although the short-term direction has turned sideways-to-negative.
Given the prevailing setup, the markets are likely to stay range-bound and prone to profit-taking unless a strong directional trigger emerges. Traders should avoid aggressive positions and instead adopt a selective, stock-specific approach while protecting profits on existing trades. A cautious stance with strict stop-losses is advised as the markets navigate through this minor corrective phase. The method to approach the coming week should be guarded optimism with selective participation.
In our look at Relative Rotation GraphsⓇ, we compared various sectors against the CNX500 (NIFTY 500 Index), representing over 95% of the free-float market cap of all the listed stocks.
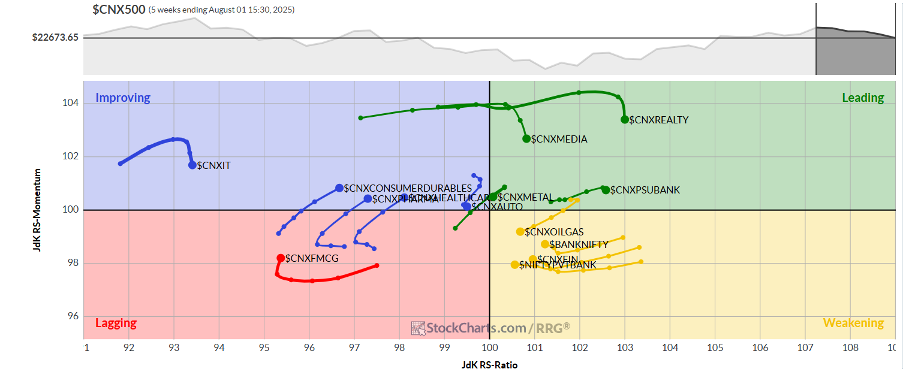
Relative Rotation Graphs (RRG) show that the Nifty Midcap 100, Energy, Media, Metal, PSE, and PSU Bank Indices are inside the leading quadrant. These groups may continue to relatively outperform the broader markets. However, sectors such as Media, PSE, and the Midcap 100 are seen slowing down on their relative momentum.
BankNifty, Financial Services, and Infrastructure Indices are inside the weakening quadrant. However, the financial space is showing improvements in its relative momentum against the broader markets.
The Nifty Services Sector is inside the lagging quadrant but is improving on its relative momentum. Besides this, the FMCG, Consumption, and the Commodities Index are languishing inside the lagging quadrant.
The IT Index is losing its relative momentum while being inside the improving quadrant. This may lead to temporary relative underperformance of this Index. Nifty Auto and Pharma Indices are inside the improving quadrant as well; the Pharma Index is seeing strong improvement in its relative momentum.
Important Note: RRG™ charts show the relative strength and momentum of a group of stocks. In the above Chart, they show relative performance against NIFTY500 Index (Broader Markets) and should not be used directly as buy or sell signals.
Milan Vaishnav, CMT, MSTA
Consulting Technical Analyst


